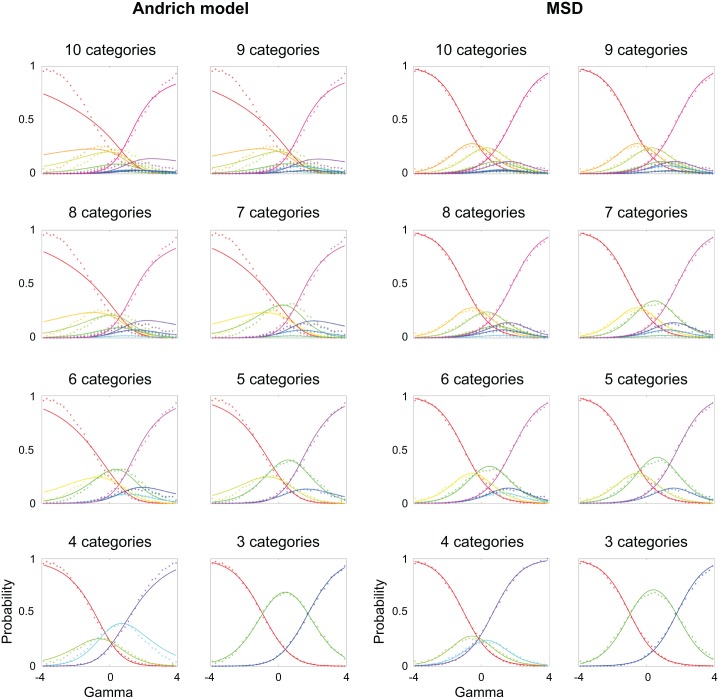
Fig 1. Comparing probability curves for the Andrich model and MSD.
Actual frequencies (dots) of observing rating categories as a function of differences in true person and item measures, or gamma, compared to the predicted values (curves) from the Andrich model (left) and MSD (right). Binning of gamma was done for the simulated data in intervals of 0.2 logits. The Andrich model becomes less accurate than MSD the greater the number of rating categories.

