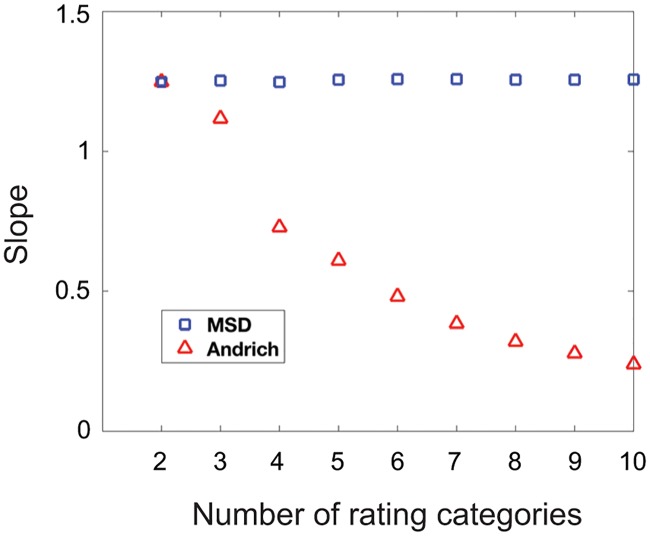
Fig 3. Slopes of the best-fitting line between estimated and true item measures.
Slopes of the best-fitting line between estimated and true item measures for MSD (blue squares) and the Andrich model (red triangles) are plotted as a function of the number of rating categories. MSD estimates parameters on the same scale regardless of the number of rating categories because it only uses the dichotomous Rasch model, while the Andrich model estimates parameters on a scale that is dependent on the number of rating categories.

