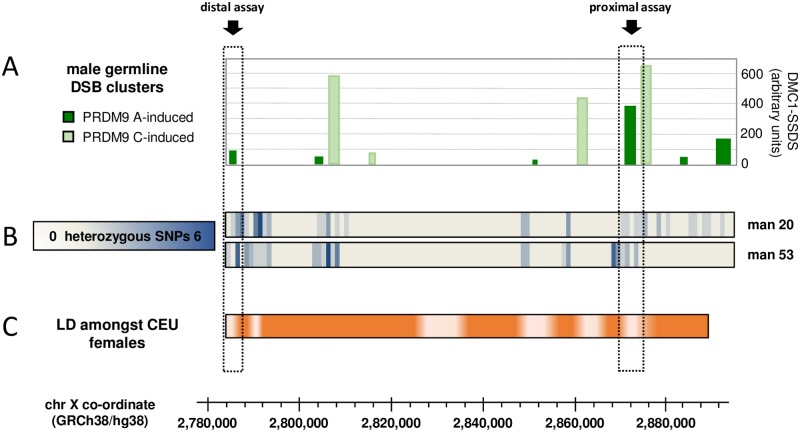
Fig 2. Choosing target regions within ePAR to assay for male germline de novo recombinants.
(A) Distribution and intensity of DSB clusters that fall within the X-derived portion of the ePAR. Clusters were defined [19] by anti-DMC1 SSDS using testis biopsies from five men and designated as being induced by PRDM9 A (dark green) or PRDM9 C (light green); DSB strength is shown as the mean across relevant individuals using the arbitrary values reported in the original work [19]. (B) Frequency of heterozygous SNP markers per 1-kb interval identified in each of the two ePAR-positive sperm donors (man 20, man 53) as determined by Ion Torrent sequencing. (C) Linkage disequilibrium (LD) heat map derived from the 50 CEU females from the 1000 Genomes Project [34] (more intense orange equates to stronger LD). Data are based on |D´| values determined from SNPs with minor allele frequency >0.2 that passed tests for Hardy-Weinberg equilibrium specifically derived for markers on the X chromosome [72]; these stringent criteria meant that LD corresponding to the most proximal portion of the ePAR interval could not be examined. Scaling is shown with respect to GRCh38/hg38, and the two chosen assay intervals, distal and proximal, are indicated by the dashed boxes and arrows. See also S2 Fig.

