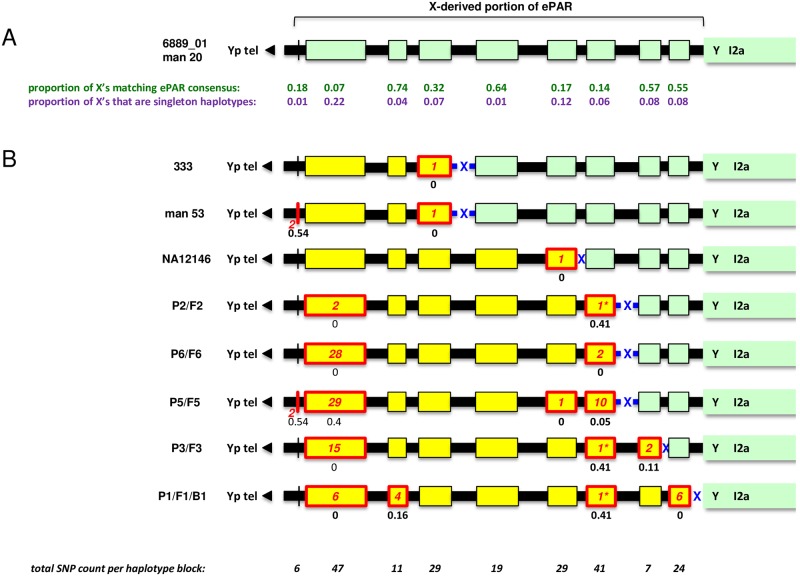
Fig 6. Simple interpretation of the I2a ePARs.
(A) Schematic of consensus X-derived portion of ePAR carried by individuals 6889_01 and man 20. Green boxes with black outlines represent the shared haplotypes at each of the nine blocks of SNP markers whilst the intervening black boxes coincide with mapped PRDM9 A and C DSB clusters [19]; widths of all boxes are proportional to their length. The black triangle to the left points towards the canonical 2.7-Mb PAR1 and ultimately to the Yp telomere; the start of Y-specific I2a sequence is shown to the right. The frequency of phase-known X haplotypes among the 95 CEU+GBR males that match the modal ePAR haplotype for each block of SNPs are shown in green; the frequencies of singleton haplotypes amongst the same are shown in purple. (B) The remaining eight I2a ePARs, assuming they are the result of a single crossover between the consensus and an incoming X-linked haplotype depicted by yellow boxes (crossover interval shown with blue cross). Boxes with red outlines show haplotype blocks that differ from the consensus with the number of SNP changes shown in red; asterisks identify three haplotype blocks that differ from the consensus by the same single base pair change. Black numbers beneath boxes indicate the observed frequency of the non-consensus haplotype amongst the 95 phase-known X haplotypes from the CEU+GBR males. Total SNP counts per block are shown in italics at the bottom.

