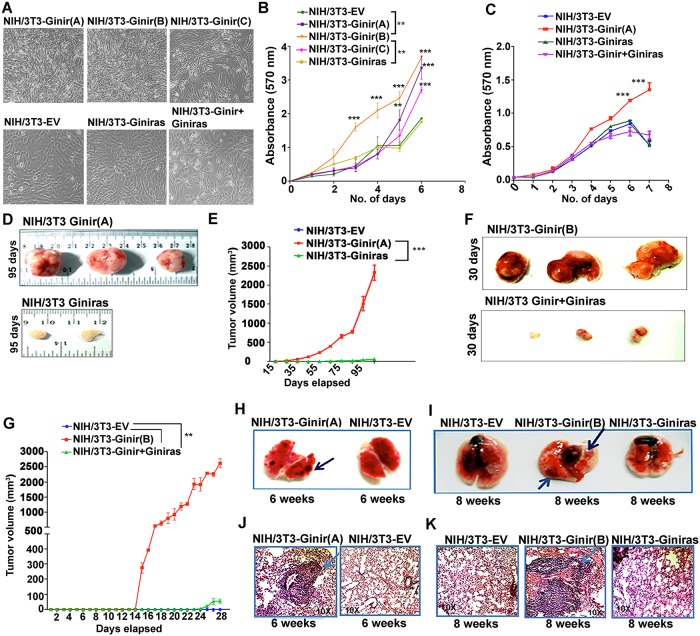
Fig 3. Ectopic expression of Ginir RNA in cells leads to malignant transformation.
(A) Phase contrast micrographs of NIH/3T3-Ginir (three independent transfectants A, B, and C), NIH/3T3-EV, NIH/3T3-Giniras, and NIH/3T3-Ginir+Giniras cells. (Magnification 4×). (B) Cell proliferation analyses of NIH/3T3-Ginir (A, B, and C) individual transfectants, NIH/3T3-Giniras, and NIH/3T3-EV transfectant cells performed by MTT assay over a period of 6 days. Values are mean ± SEM (n = 3); **P ≤ 0.001 by repeated-measures one-way ANOVA test. (C) Cell proliferation analyses of NIH/3T3-EV, NIH/3T3-Ginir(A), NIH/3T3-Giniras, and NIH/3T3-Ginir+Giniras cells performed by MTT assay over a period of 7 days. Values are mean ± SEM (n = 3); ***P ≤ 0.0001; by repeated-measures one-way ANOVA test. (D) Representative xenograft tumours of NIH/3T3-Ginir(A) and NIH/3T3-Giniras cells generated in NOD/SCID mice. Tumour growth was monitored for 95 days. Tumourigenicity assays were performed at least 5 times with 3 mice in each group. (E) Tumour growth kinetics determined by measuring tumour volumes at an interval of 10 days over a period of 95 days. Values represent means ± SEM. ***P ≤ 0.0001, one tailed, by two-way ANOVA test. (F) Representative xenograft tumours of NIH/3T3-Ginir(B) and NIH/3T3-Ginir+Giniras cells generated in NOD/SCID mice. Tumour growth was monitored for 30 days (n = 3). Tumourigenicity assays were performed at least 3 times with 3 mice in each group. (G) Tumour growth kinetics monitored by measuring tumour volumes periodically up to duration of 30 days. Values represent mean ± SEM. ***P ≤ 0.0001, one tailed, by two-way ANOVA test. (H and I). In vivo lung colonisation assay in NOD/SCID mice performed via tail vein injection of NIH/3T3-Ginir(A) (H) and NIH/3T3-Ginir(B) (I) cells along with NIH/3T3-EV and NIH/3T3-Giniras cells as controls. Images represent lung tissues dissected from mice injected with mentioned cell lines after 6 (H) and 8 weeks (I) of introduction of cells. The assays were performed at least 3–5 times with n = 3 mice. (J and K) HE staining of lung tissue from mice injected with NIH/3T3-Ginir(A) (J) and NIH/3T3-Ginir(B) (K) cells. Supporting data for B, C, E and G can be found in S1 Data. Ginir, Genomic Instability Inducing RNA; Giniras, antisense RNA of Ginir; HE, haematoxylin–eosin; MTT, 3-(4, 5-dimethylthiazol-2-yl)-2, 5-diphenyltetrazolium bromide.

