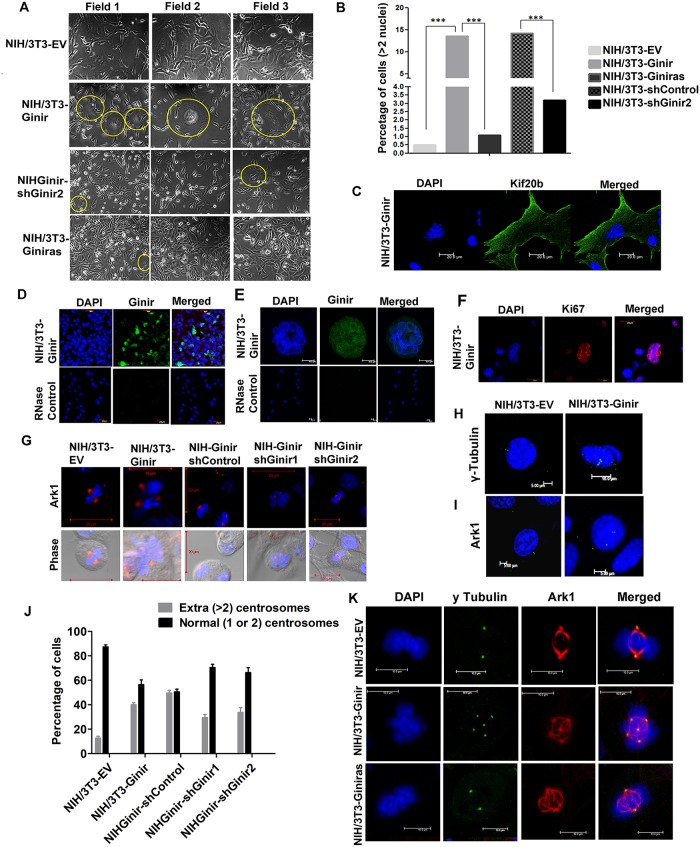
Fig 8. Ginir induces mitotic defects and impairs cytokinesis, forming multinucleated giant cells.
(A) Phase contrast micrographs demonstrating multinucleated giant cells present in mentioned cell lines. Encircled areas highlight the multinucleated giant cells amongst mononucleated proliferating cells (10× magnification). (B) Quantification of multinucleated cells in the indicated cell lines, expressed as percentage of cells with >2 nuclei. Nuclei were stained with DAPI. Images were acquired using confocal microscope. About 400 cells were counted manually for all cell lines except for NIH/3T3-Giniras, for which only about 200 cells were counted. Bars represent mean values ± SEM; **P values > .001 using Student’s t test. (C) Representative Kif20b staining in NIH/3T3-Ginir cells demonstrating the presence of multinucleated giant cells. Nuclei were stained with DAPI (blue) and viewed under confocal microscope. Scale bar 20 μm. (D and E) Representative RNA-FISH images stained with Ginir-specific LNA probe-1 (green) in NIH/3T3-Ginir cells (D). Magnified image of one of the multinucleated cells in NIH/3T3-Ginir cells. Nuclei were stained using DAPI (E). Scale bars 10 μm. (F) Representative Ki67 antigen staining in multinucleated giant cells of NIH/3T3-Ginir cells, demonstrating its strong expression. Nuclei were stained with DAPI. Scale bar 20 μm. (G) Immunofluorescence staining of the centrosome marker protein Ark1 in multinucleated giant cells. Nuclei were stained with DAPI. Scale bars 20 μm. (H) Immunofluorescence detection of the centrosome marker protein ɣ-tubulin in indicated interphase cells. Nuclei were stained with DAPI. Scale bars 5 and 10 μm. (I) Immunofluorescence detection of the centrosome marker protein Ark1 in mentioned interphase cells. Nuclei were stained with DAPI. Scale bars 5 μm. (J) Histogram plot demonstrating centrosome numbers in indicated cell lines. The percentage of cells with amplified (i.e., more than 2) and cells with a normal number of centrosomes (1 to 2) were visually scored from both metaphase and interphase cells. A minimum of 150 cells were counted for centrosome number by staining with γ-tubulin. The scoring was based on data from at least 3 independent experiments. Data shown represent mean ± SEM. ***P ≤ 0.0001, one tailed, one-way ANOVA test. (K) Images representing coexpression of a centrosome marker protein γ-tubulin with Ark1 in mitotically active cells. Nuclei were stained with DAPI. Scale bars 10 μm. Supporting data for B and J can be found in S5 Data. Ark1, aurora-related kinase 1; Ginir, Genomic Instability Inducing RNA; Kif20b, kinesin family member 20; RNA-FISH, RNA fluorescence in situ hybridisation.

