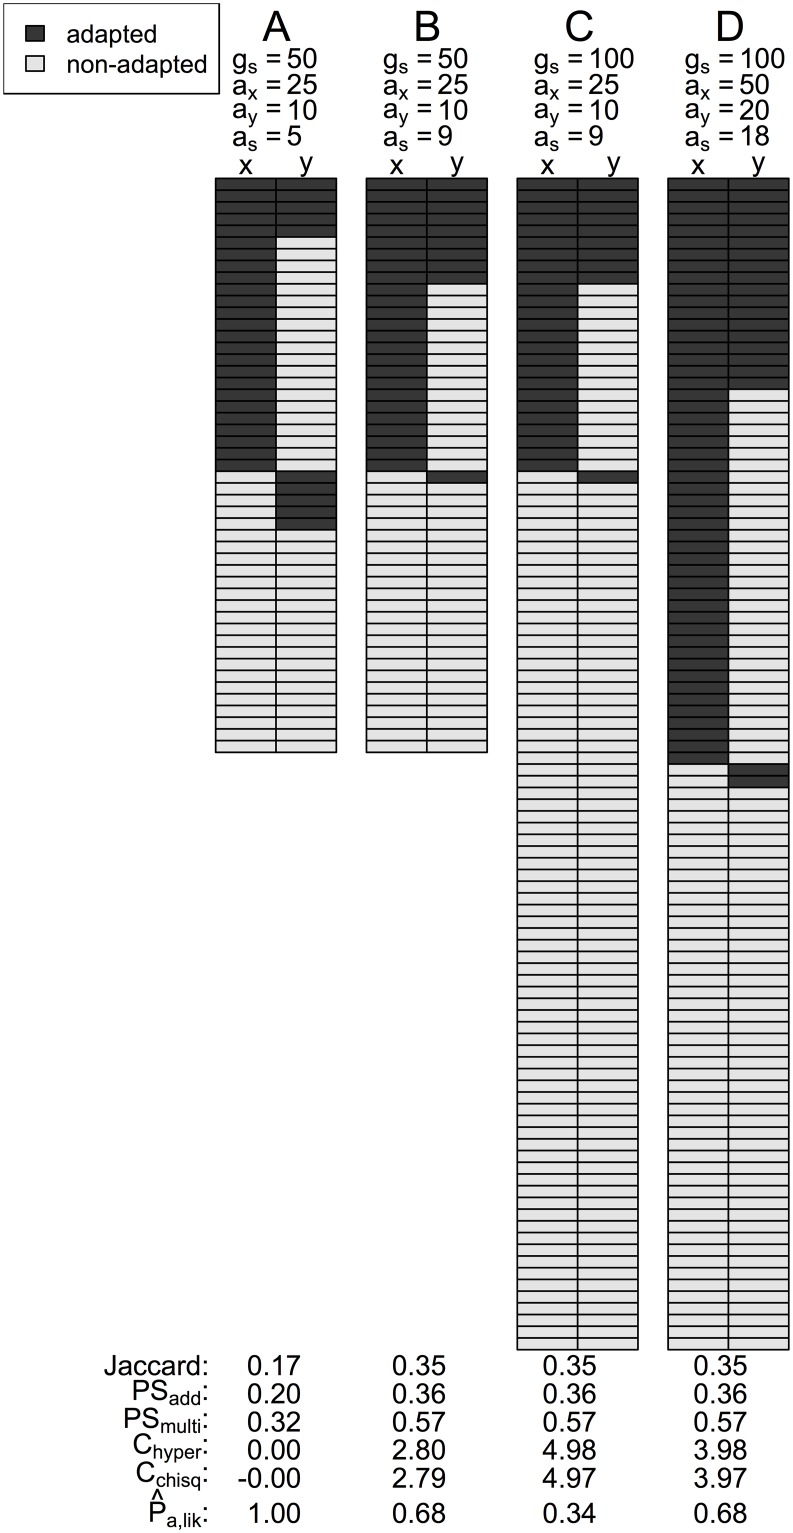
Fig 3. Four example datasets showing different levels of convergent adaptation and a comparison of different indices assessing overlap among adapted genes.
Scenario A is unconstrained and exactly equal to the mean expectation under a random draw; scenarios B & C show the same amount of overlap (as) and number of adaptively mutated genes (ai), but scenario C is drawn from a larger number of potential genes (gs). Scenario D has the same proportion of overlap as B & C, but twice as many adapted genes.

