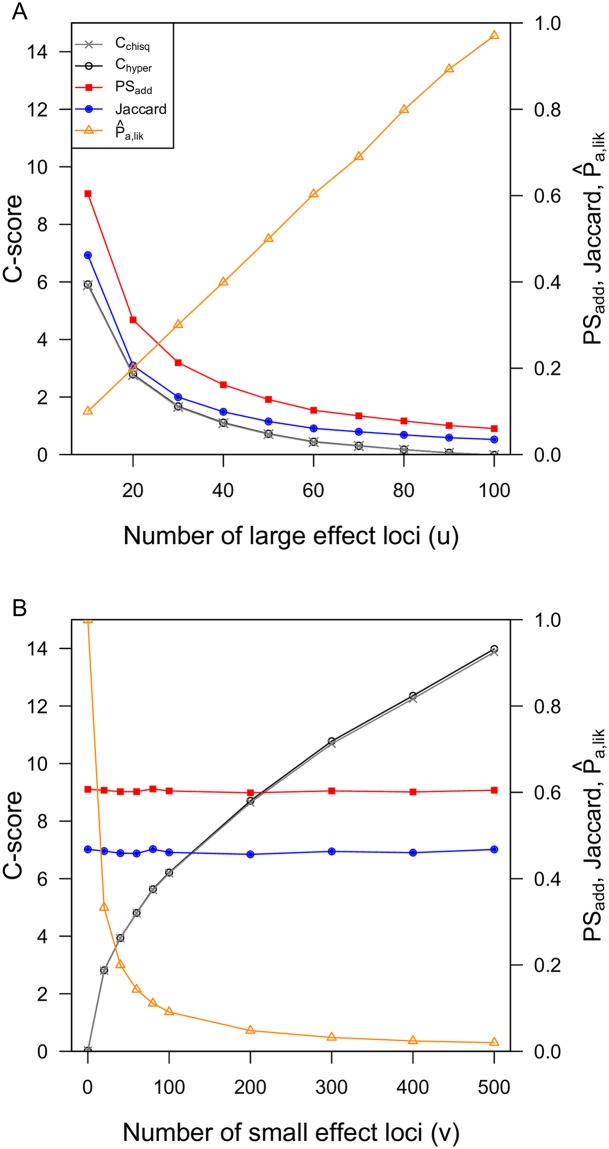
Fig 4. C-score indices of constraint are qualitatively similar to Jaccard and PSadd indices of repeatability when simulations have a constant size of mutational target (A), but differ when simulations vary in the size of mutational target (B).
shows qualitatively similar patterns to the C-scores, with a decreasing proportion of the genome accessible to adaptation occurring in scenarios with higher C-scores and higher constraints. In panel A, all runs have ns = gs = 100 loci, with u large effect loci and (100 − u) small-effect loci. In panel B, there are 10 large-effect loci, and v small-effect loci. In both scenarios, simulations were run with N = 10,000 individuals in each patch, recombination rate of r = 0.5 between loci, and per-locus mutation rate = 10−5. The calculation of Chyper is based on categorizing genes as adapted when FST > 0.1, while the calculation of Cchisq is based on FST standardized by subtracting the minimum value and dividing by the maximum within each lineage.

