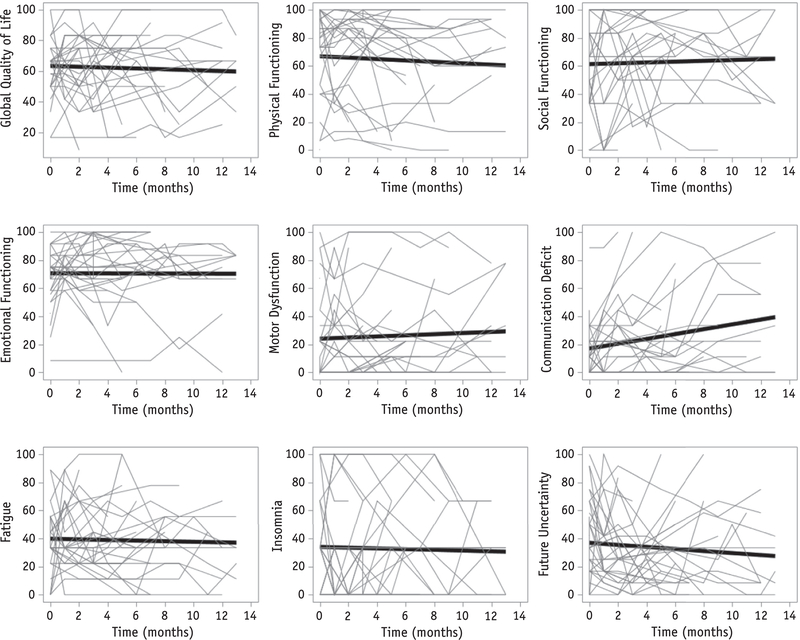
Fig. 1.
In the 9 health-related quality of life scores selected for primary analysis, all except communication deficit (P =.008) remained stable over time. The trend lines are the predicted values from our repeated measures model and are superimposed on the spaghetti plot to show how the trend relates to the lines for the individual patients.

