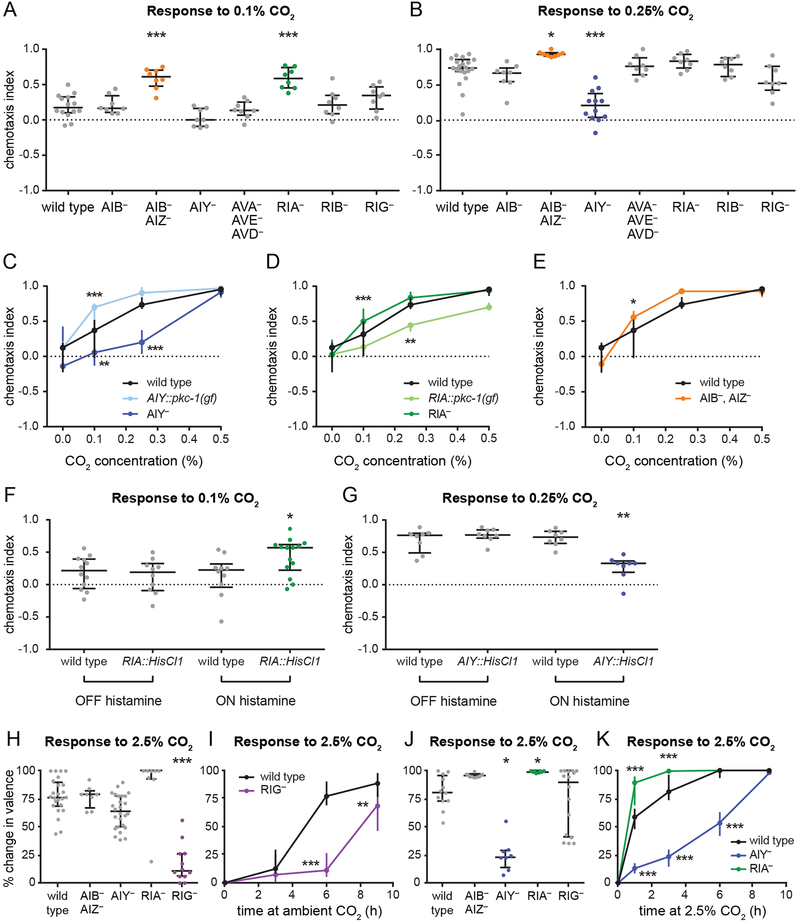
Figure 3. The same set of interneurons contributes to CO2 avoidance and attraction.
(A-B) In animals raised at high (2.5%) CO2, silencing of AIZ and ablation of RIA enhances CO2 attraction, while ablation of AIY reduces CO2 attraction. Graphs show responses to 0.1% CO2 (A) or 0.25% CO2 (B). *p<0.05, ***p<0.001, one-way ANOVA with Dunnett’s post-test (A) or Kruskal-Wallis test with Dunn’s post-test (B). n=6–20 trials per genotype and condition.
(C) Ablation of AIY reduces CO2 attraction. By contrast, animals with more active AIY neurons due to AIY-specific expression of pkc-1(gf) show enhanced CO2 attraction. Animals were raised at high (2.5%) CO2. **p<0.01, ***p<0.001, two-way ANOVA with Dunnett’s post-test. n=6–20 trials per genotype and condition.
(D) Ablation of RIA enhances CO2 attraction. By contrast, animals with more active RIA neurons due to RIA-specific expression of pkc-1(gf) show reduced CO2 attraction. Animals were raised at high (2.5%) CO2. **p<0.01, ***p<0.001, two-way ANOVA with Dunnett’s post-test. n=8–24 trials per genotype and condition.
(E) Silencing of AIZ enhances CO2 attraction. Animals were raised at high (2.5%) CO2. *p<0.05, two-way ANOVA with Sidak’s post-test. n=8–20 trials per genotype and condition.
(F-G) Animals with RIA neurons transiently silenced by expression of the histamine-gated chloride channel HisCl1 in RIA show enhanced CO2 attraction (F). By contrast, animals with AIY neurons transiently silenced using the same approach show reduced CO2 attraction (G). Responses to 0.1% CO2 (F) and 0.25% CO2 (G) were tested for wild-type animals and animals expressing HisCl1 in either RIA or AIY without histamine (negative control) and with histamine (neuronal silencing); changes in CO2 response were observed only in the presence of histamine. Animals were raised at high (2.5%) CO2. *p<0.05, **p<0.01, one-way ANOVA with Sidak’s post-test (F) or Kruskal-Wallis test with Dunn’s post-test (G). n=8–14 trials per genotype and condition.
(H-I) Ablation of RIG delays the shift from CO2 attraction to repulsion in animals raised at high (2.5%) CO2 and transferred to ambient CO2. Animals were tested for their response to 2.5% CO2 after 3, 6, or 9 h at ambient CO2. Responses were compared to those of animals of the same genotype raised at ambient CO2 and high CO2 to determine the percent change in valence (see Methods). Graphs show the percent change in valence after 6 h (H) or as a function of time (I). **p<0.01, ***p<0.001, Kruskal-Wallis test with Dunn’s post-test (H) or two-way ANOVA with Sidak’s post-test (I). n=8–26 trials per genotype, time point, and condition.
(J-K) Ablation of AIY delays the shift, and ablation of RIA accelerates the shift, from CO2 repulsion to attraction in animals raised at ambient CO2 and transferred to high (2.5%) CO2. Animals were tested for their response to 2.5% CO2 after 1, 3, 6, or 9 h at high CO2. Responses were compared to those of animals of the same genotype raised at ambient CO2 and high CO2 to determine the percent change in valence (see Methods). Graphs show the percent change in valence after 3 h
(J) or as a function of time (K). *p<0.05, ***p<0.001, Kruskal-Wallis test with Dunn’s post-test (J) or two-way ANOVA with Dunnett’s post-test (K). n=8–16 trials per genotype, time point, and condition.
For A-K, graphs show medians and interquartile ranges. See also Figure S3.

