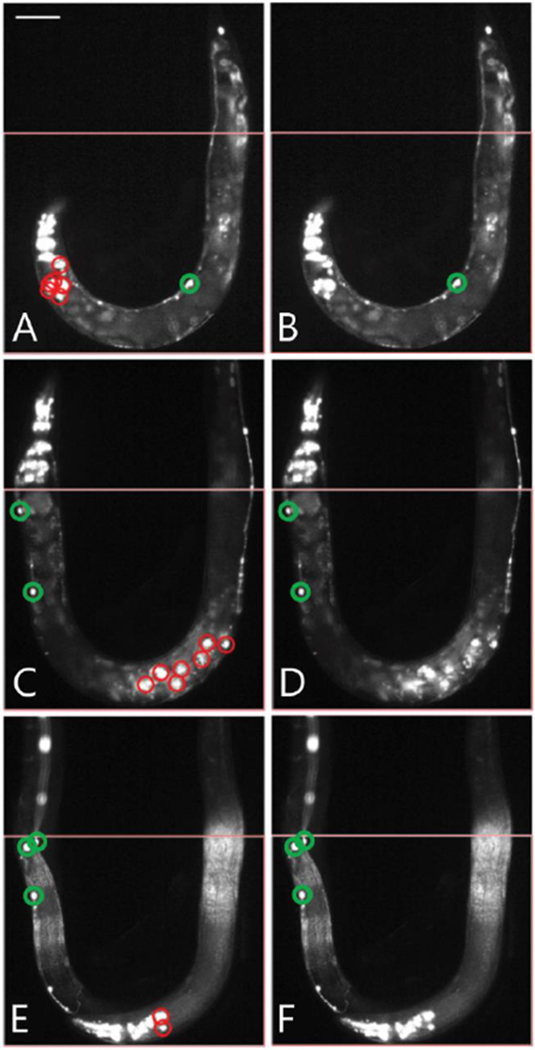
Fig. 3.

Application of mean-filter to remove false positives. (A) Image of randomly mutated smn-1(RNAi sas) animal loaded on-chip with the head region present in the analysis area. Co-injection marker expressing cells, not removed by previous analysis steps, are falsely detected as neurons, labelled in red. (B) Results of mean and size filter to remove false-positives from panel A. Objects that were previously detected in the head region have been removed. Final results shown in green. (C) Image of randomly mutated smn-1(RNAi sas) animal loaded on-chip demonstrating egg laying deficiency. Fluorescent markers of progeny within parent falsely detected as neurons labelled in red. (D) Results of mean and size filter, objects previously detected within the animal body removed. Final results shown in green. (E) Example of multiple animals within the imaging area. Falsely detected neurons from the head of one animal are detected along with neurons from the other animal’s body. Falsely detected D-type neurons shown in red. (F) Results after applying mean and size filter to remove co-injection markers seen in head of worm. Final results shown in green. Scale bar for all panels is 70μm. All animals carry the transgenes oxIs12[Punc-47::GFP] and gbIs4[Punc-25::smn-1(RNAi sas)].
