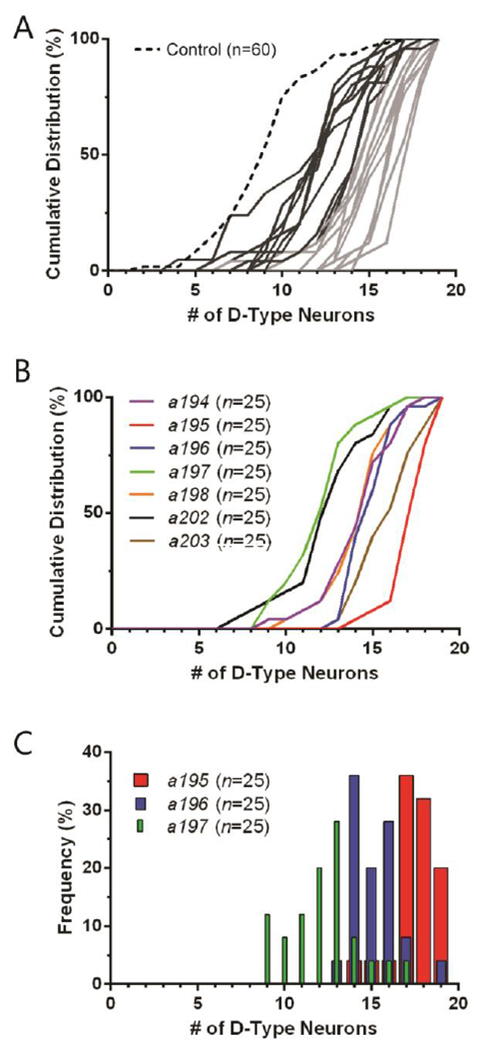
Fig. 5.

Characterization of isolated alleles. (A) Cumulative distribution functions (CDF) for isolated alleles from automated suppressor screen. Control is smn-1(RNAi sas) single mutant (non mutagenized) and is shown in dashed black line;s putative double mutant alleles in grey. Lighter grey designates alleles considered to be strong suppressors of the smn-1(RNAi sas) phenotype. (B) CDFs for seven alleles isolated from same F1 parent population (possible siblings). (C) Histogram for alleles a195, a196, and a197 shown in panel B. Only data from manual scoring, not image analysis, was used for this figure.
