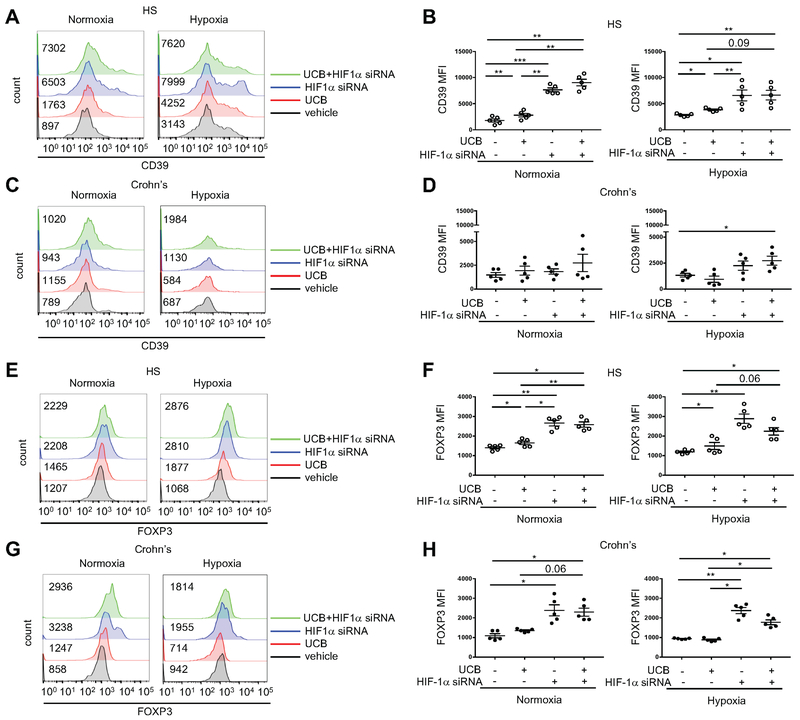
Fig. 2. Blockade of hypoxia restores Th17-cell ability to respond to AhR ligation.
Representative histograms of (A and C) CD39 and (E and G) FOXP3 mean fluorescence intensity (MFI) of Th17-cells differentiated from peripheral blood CD4+ cells of one HS and one patient with Crohn’s disease. Cells were treated with either UCB, HIF-1α siRNA or UCB plus HIF-1α siRNA, under normoxic or hypoxic conditions. Untreated (vehicle) controls are also shown. For the flow cytometry analysis, cells were initially gated on CD4+IL17+ lymphocytes; then CD39 and FOXP3 MFI was measured. Numerical values of CD39 and FOXP3 MFI in untreated, UCB or UCB plus HIF-1α siRNA-treated Th17-cells are indicated within the histogram plots. Mean ± SEM (B and D) CD39 and (F and H) FOXP3 MFI of Th17-cells (HS, n=5; Crohn’s patients, n=5).
Comparisons were made using one-way ANOVA, followed by Tukey’s multiple comparison test. *P≤0.05;**P≤0.01;***P≤0.001.

