
Figure 4.
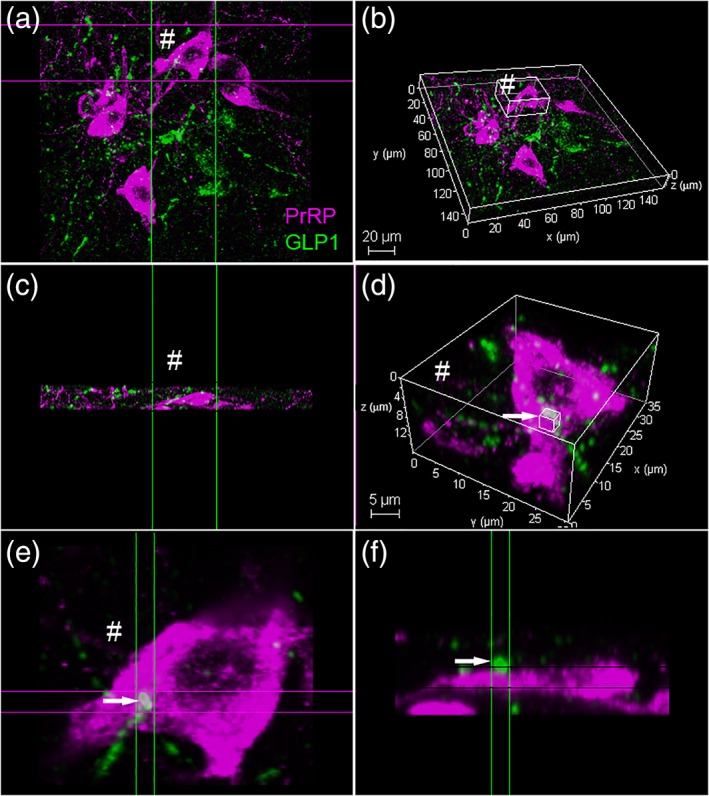
Confocal imaging of dual PrRP (magenta) and GLP‐1 (green) immunofluorescence in the rat cNTS. (a) Maximum projection (z‐stack) 3D image, slightly rotated in (b) to reveal the same region. (c) A “side view” image stack of the same PrRP+ neuron indicated by # in panels (a and b). (d) Higher‐magnification view of the same # neuron, revealing close appositions formed by GLP‐1+ terminals (green) onto the PrRP neuron. The smaller boxed region (arrow) is depicted at even higher magnification in (e) (“top down” view) and (f) (“side view”), revealing no apparent gap between the green and magenta profiles (arrow). Scale bars: (b) 20 μm; (d) 5 μm. GLP‐1 = glucagon‐like peptide‐1; PrRP = prolactin‐releasing peptide [Color figure can be viewed at http://wileyonlinelibrary.com]