
Figure 6.
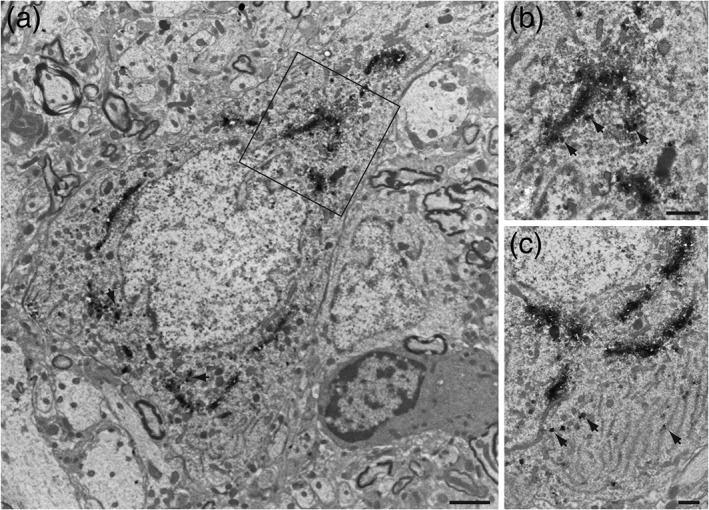
Electron micrographs illustrating the cellular localization of GLP‐1 immunoperoxidase reaction within the rat caudal nucleus of the solitary tract. (a) GLP‐1+ neurons had a long axis of 10–15 μm and a short axis of 7–10 μm with a prominent centrally placed cell nucleus. (b) Immunoperoxidase labeling within neurons was densely concentrated in Golgi complexes surrounding the cell nucleus and in large vesicles associated with the cis face of the Golgi (arrows in (b)) or distributed among cisternae of the rough endoplasmic reticulum in the cell cytoplasm (arrows in (c)). Scale bars: 2 μm in each panel