
Figure 11.
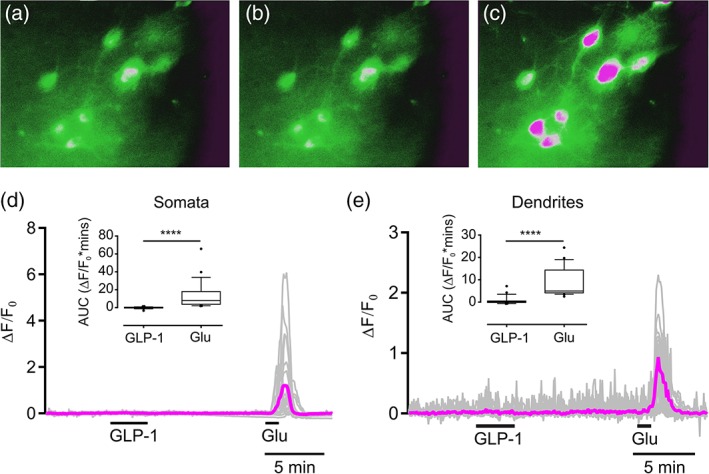
Optical recordings of the intracellular Ca2+ concentration in pre‐proglucagon (PPG) neurons reveal a lack of response to GLP‐1. (a–c) Pseudocolored micrographs showing Ca2+ levels in eight PPG neurons under different conditions: control (a), 100 nM GLP‐1 (b), 100 μM glutamate (c). (d) The gray traces show the individual somatic responses of 27 PPG neurons (from three mice) to 100 nM GLP‐1 and 0.1 mM glutamate, and the magenta trace shows the mean response from these cells. (e) Gray traces show the individual responses of 23 PPG dendrites (from three mice) to 100 nM GLP‐1 and 0.1 mM glutamate, and the magenta trace shows the mean response from these dendrites. In both (d) and (e), statistical analysis of the responses expressed as AUC is shown as a box plot with whiskers, with the median indicated and whiskers marking the 10th and 90th percentile, and outliers represented by black filled circles. Significance was determined with a Wilcoxson test. ****p < .0001. AUC = area under the curve; GLP‐1 = glucagon‐like peptide‐1 [Color figure can be viewed at http://wileyonlinelibrary.com]