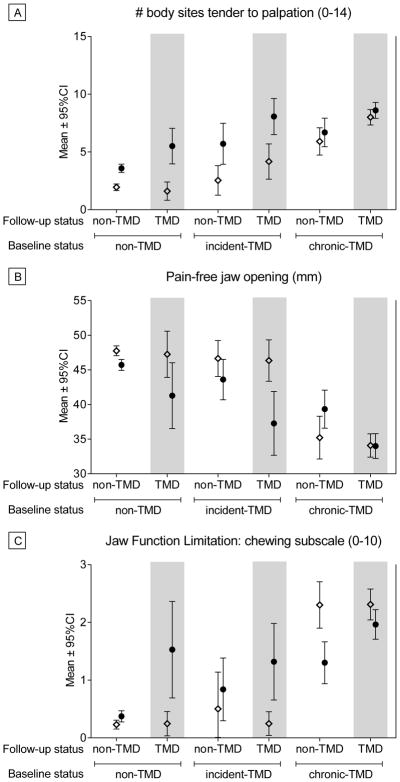
Figure 2.
Selected Clinical and Health Measures for Each Group at Baseline and Follow-Up. Three measures are presented for illustrative purposes to show observed patterns of change over time across groups. a) Number of body sites painful to palpation during examination; b) Pain-free jaw opening measured during examination, in which higher scores show greater range of motion; c) Jaw Function Limitation Scale chewing subscale score, when higher scores indicate greater functional limitations. Open diamonds (⋄) reflect Baseline values and closed circles (●) reflect Follow-Up values. No statistical inference testing was performed on these data, as our statistical approach modeled the change scores as presented in Tables 2, 3 and 4.

