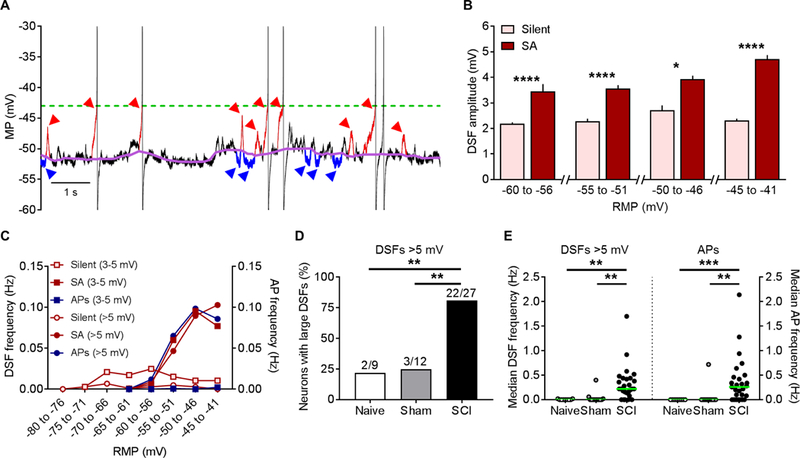
Figure 4. SCI enhances the amplitudes and frequencies of DSFs in NA neurons. DSFs were quantified with an automated algorithm that estimates RMP via a sliding median function, and then identified SFs exceeding 1.5 mV above and below this continuously changing reference line (see Methods). (A) Sample recording of SA following SCI. Color labels: purple undulating line - sliding median, red arrowheads and red trace segments - subthreshold and suprathreshold DSFs ≥3 mV, blue arrowheads and blue trace segments – all HSFs ≥1.5 mV, green dashed line - AP threshold. (B) Neurons with SA (n = 27) showed enhanced DSF amplitudes compared to silent neurons at RMPs between −60 and −40 mV. DSFs were binned according to the RMP at DSF onset. DSF sample sizes left to right: 286, 68, 186, 386, 49, 568, 91, and 425. Data shown as mean ± SEM. Comparisons between silent and SA groups at each bin made using Mann-Whitney U tests. (C) The frequency of medium-amplitude DSFs (3–5 mV, squares) and large DSFs (>5 mV, circles) increased at more depolarized RMPs in neurons with SA (solid symbols) but not in silent neurons (open symbols), paralleling the increase in AP frequency (blue circles). Almost no APs were triggered by medium-sized DSFs (blue squares) in neurons with or without SA. DSFs and APs from neurons in naïve, sham, and SCI conditions were pooled together into silent and SA groups for analysis. Each point represents frequency (Hz) calculated by dividing the total number of DSFs or APs by the number of neurons per group (silent n = 21, SA n = 27) and the recording duration (50 s for each neuron). (D) Large DSF incidence was significantly greater following SCI. Fractions represent number of neurons exhibiting large DSFs/total sample. Comparisons made using Bonferroni-corrrected Fisher’s exact tests. (E) SCI increased the frequency of large DSFs and APs in each neuron. Green lines - medians. Overall significance assessed with Kruskal-Wallis test, multiple comparisons with Dunn’s tests. *P < 0.05, **P < 0.01, ***P < 0.001, ****P < 0.0001. Neurons are a randomly selected subset taken from the naïve (n = 2), sham (n = 3), and SCI rats (n = 8) used in Figure 3.