
Figure 1.
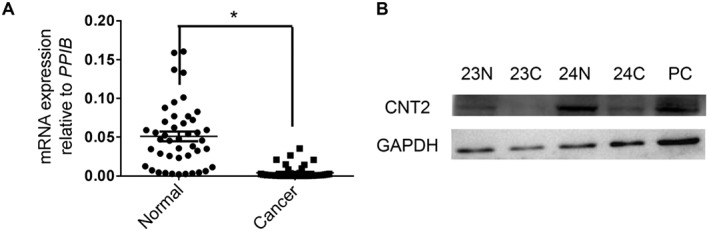
CNT2 is repressed in CRC. (A) RT‐qPCR analysis of CNT2 transcription in matched CRC tissues and adjacent normal tissues normalized to reference gene PPIB . Individual data points are shown, with means and SEM indicated by horizontal lines; n = 44, *P < 0.05, significantly different as indicated; two‐tailed paired t‐test. (B) Western blot of CNT2 and GAPDH in matched CRC tissues (24C, 23C) and adjacent normal tissues from the same individual (23N, 24N). Normal liver tissue was used as the positive control (PC), as recommended.