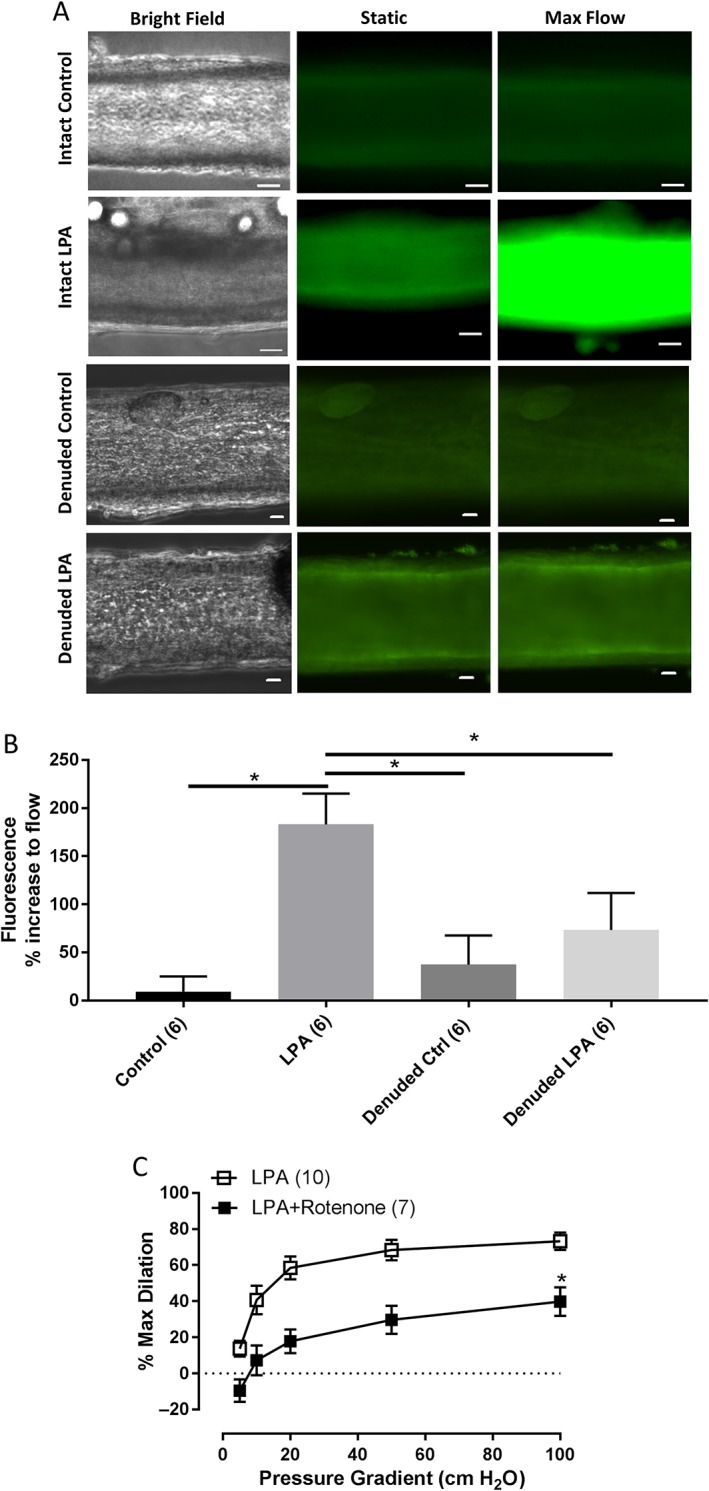
Figure 6.

Intracellular source of H2O2 in arterioles after LPA challenge. (A) Representative images of cannulated vessels perfused intraluminally with mito peroxy yellow (MitoPY1) under intact control (n = 6), intact LPA treatment (n = 6), denuded control (6) and denuded LPA treatment (6). Images show bright field, static (no flow) and 5 min of flow (100 cm H2O gradient). (B) Quantification of mitochondrial H2O2 expressed as % increase in fluorescence from baseline (static) to 5 min of maximal (100 cmH2O) flow. *P < 0.05 intact control versus intact LPA, intact LPA versus denuded control and intact LPA versus denuded LPA. (C) Source of dilator H2O2 was determined by incubating vessels with a mitochondria‐targeted inhibitor, rotenone (1 μM) for 30 min after LPA challenge. n = 10 and 7 respectively. *P < 0.05 versus LPA. Bar for all images = 20 μm.
