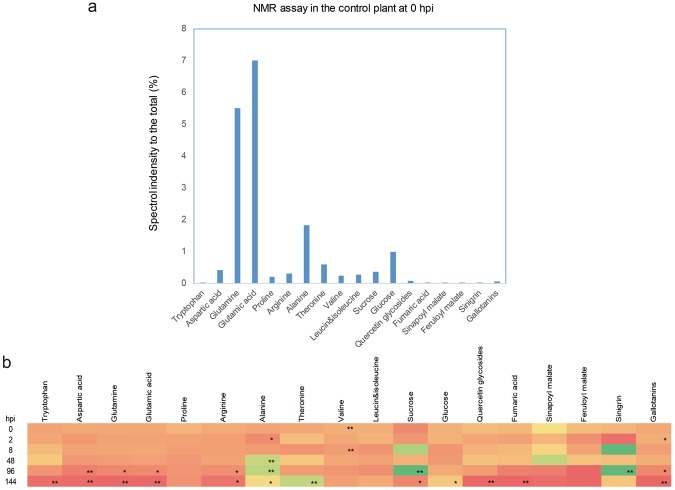
Figure 2.
NMR analysis of inoculated plantlet from 0 hpi to 144 hpi. (a) Relative amounts of different compounds in the mock-treated sample at 0 hpi. (b) Dynamic changes in abundance of the compounds assayed over time. Color indicates the ratio of compound abundance in the inoculated samples to that in the mock-treated samples: red, 0; yellow, 1; and green, the maximum value (64.5, in sinigrin at 96 hpi). Single asterisk means p < 0.05; double asterisk means p < 0.01.

