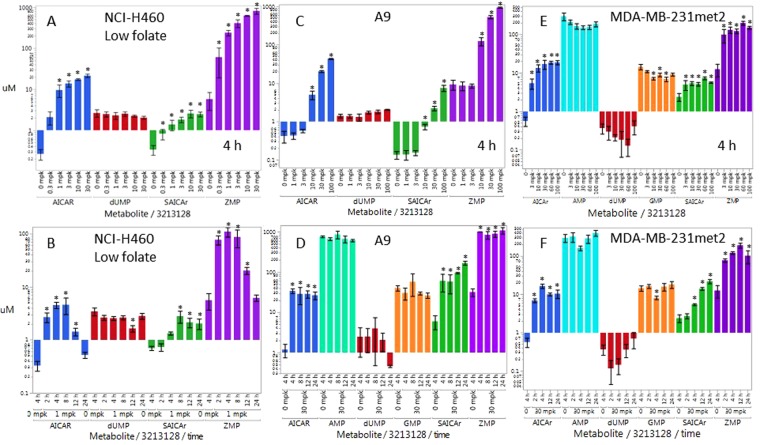
Figure 4.
Pharmacodynamic response of ZMP (purple), AICAR (blue), SAICAR (green), dUMP (red), AMP (aqua) & GMP (orange) metabolites in tumors following a single PO dose of LSN3213128 in athymic nude mice. The dose response for the above metabolites following a PO dose of LSN3213128 at 4 hours are shown for (A) NCI-H460 on low folate chow, (C) A9 on standard chow, (E) MDA-MB-231met2 on standard chow. The time course for the above metabolites following a PO dose of LSN3213128 are shown for (B) NCI-H460 at 1 mg/kg on low folate chow, (D) A9 at 30 mg/kg on standard chow, (F) MDA-MB-231met2 at 30 mg/kg on standard chow. A * above the bar indicates a p-value < 0.05 using mean comparisons to vehicle control, Dunnett’s method using JMP 12.1.0.

