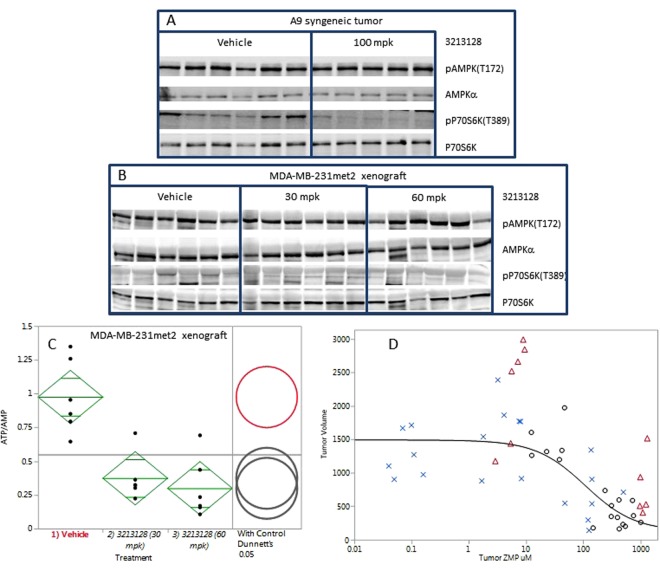
Figure 6.
(A) The AMPK T172 and P70S6K T389 phosphorylation levels after 100 mg/kg BIDx12 PO dose of LSN3213128 are shown for A9 tumors. The levels of total AMPKα and P70S6K are also shown. (B) The AMPK T172 phosphorylation levels after 30 and 60 mg/kg BIDx22 PO dose of LSN3213128 are shown for MDA-MB-231met2 tumors. The levels of total AMPKα are also shown. (C) Plot of ATP/AMP ratio after 30 and 60 mg/kg BIDx22 PO dose of LSN3213128 from MDA-MB-231met2 tumors are shown using mean comparisons to vehicle control, Dunnett’s method using JMP 12.1.0. (D) A plot shows tumor volume for human large cell lung cancer NCI-H460 (blue X), human triple negative breast cancer MDA-MB231met2 (black circles) and murine A9 tumor (red triangle) vs ZMP levels. The black solid line is a fit of the human MDA-MB-231met2 and NCI-H460 data to a three parameter logistic with an IC50 of 108 ± 78 uM, a Max of 1490 ± 120 mm3 and a Min of 125 ± 262 mm3. Full images and the croppings used in this figure are shown in Supplemental Figures S14–S21.

