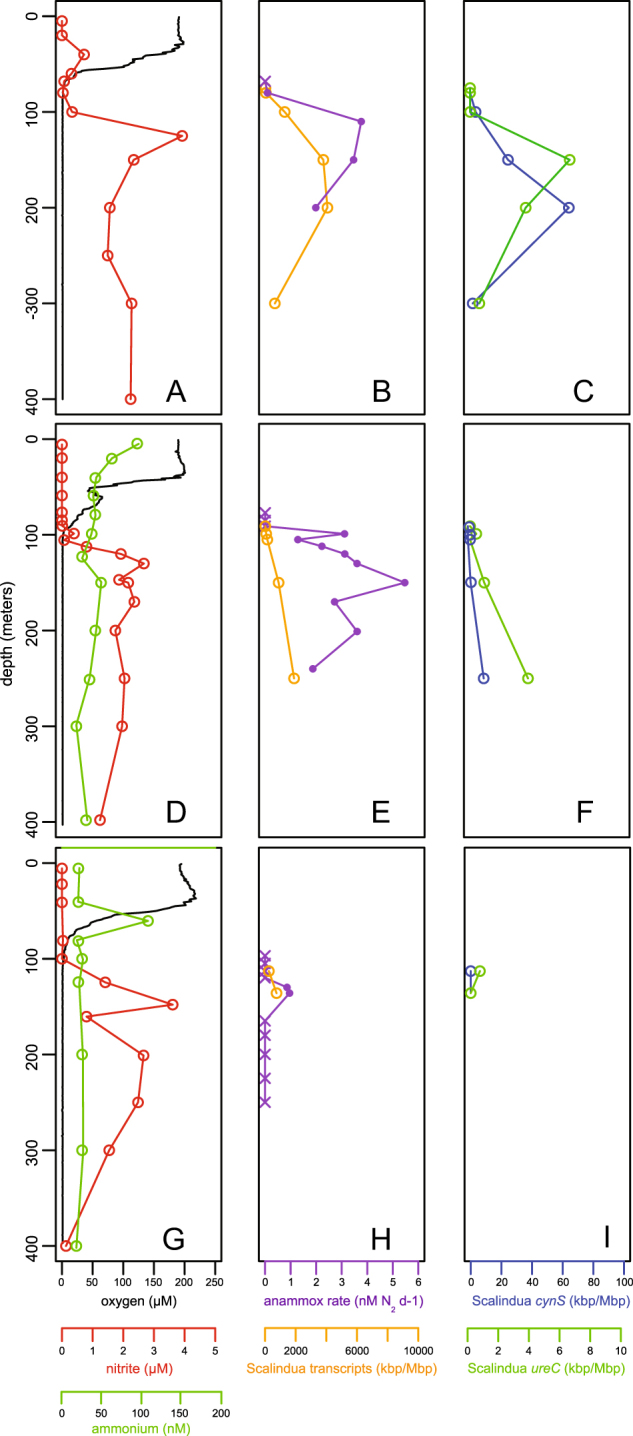
Fig. 1.

Anammox rates and representation of ETNP Ca. Scalindua transcripts relative to dissolved oxygen, ammonium, and nitrite concentrations at three ETNP stations: 6 (a–c), 7 (d–f), and 3 (g–i). The first column displays dissolved oxygen (black line, μM), nitrite (red circles and line, μM), and ammonium (green circle and line, nM). An ammonium profile at station 6 showed concentrations consistently above 140 nM, which is inconsistent with all other stations sampled and with AMZ literature to date. We therefore interpret this signal as potential contamination and have excluded these data. The second column displays anammox rates (purple line and circles) and the cumulative contribution of all transcripts recruiting to ETNP Ca. Scalindua (orange circle and lines, kbp/Mbp). Purple crosses denote non-significant rates. Transcript representation is calculated as length-corrected kilobase pairs of transcripts mapping (via BLASTX, with bit score >50 and AAI >95%) to a composite ETNP Ca. Scalindua SAG database, per Megabase pairs sequenced. The third column designates the activity and distribution of cyanate hydratase (cynS) and urease (ureC) transcripts associated with ETNP Ca. Scalindua. For all rows, the y-axis indicates water column depth. SAG samples were collected from 125 to 300 m at station 6 in 2013
