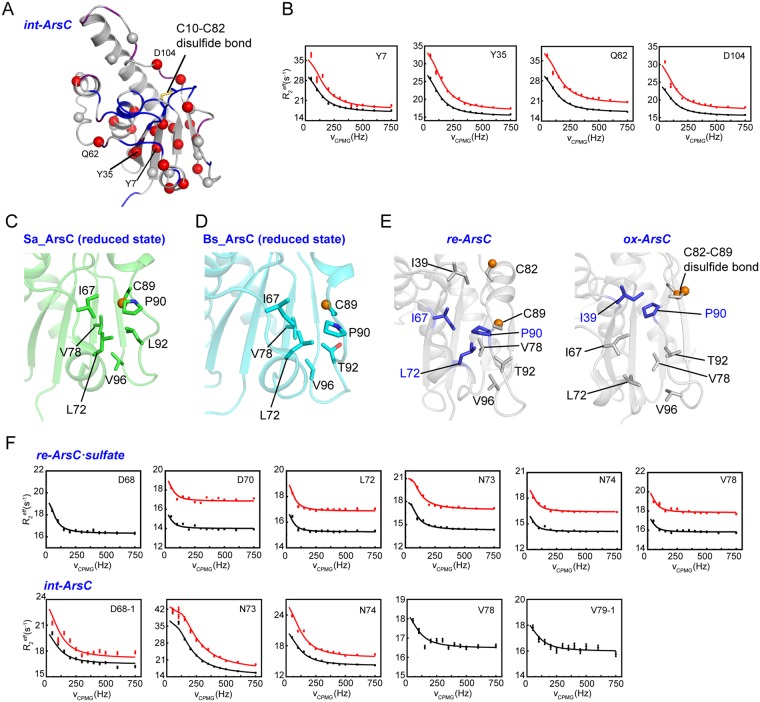
Figure 4.
CPMG RD results of int-ArsC. (A) Mapping of residues showing conformational exchanges in int-ArsC identified by CPMG RD experiments onto the structure model (shown as spheres). Residues with missing backbone amide resonances are colored blue, and residues with weak signals are colored purple. (B) Representative RD profiles of residues in int-ArsC obtained on 600-MHz (black) and 800-MHz (red) spectrometers. (C,D) The local conformation of the hydrophobic pocket that C89 occupies in the reduced state of Sa_ArsC (C, PDB code: 1ljl) and Bs_ArsC (D, PDB code: 1z2d). (E) Comparison of the local structural changes of the hydrophobic pocket in re-ArsC and ox-ArsC showing the packing of P90 either with I67, I72 in re-ArsC (left) or with I39 in ox-ArsC (right). (F) Representative RD profiles of residues in the 70 s segment in re-ArsC·sulfate (upper panel) and int-ArsC (lower panel) obtained on 600-MHz (black) and 800-MHz (red) spectrometers. The data for D68 in re-ArsC·sulfate and V78 and V79 in int-ArsC obtained at B0 field of 800 MHz were excluded from analysis due to relatively large experimental errors.

