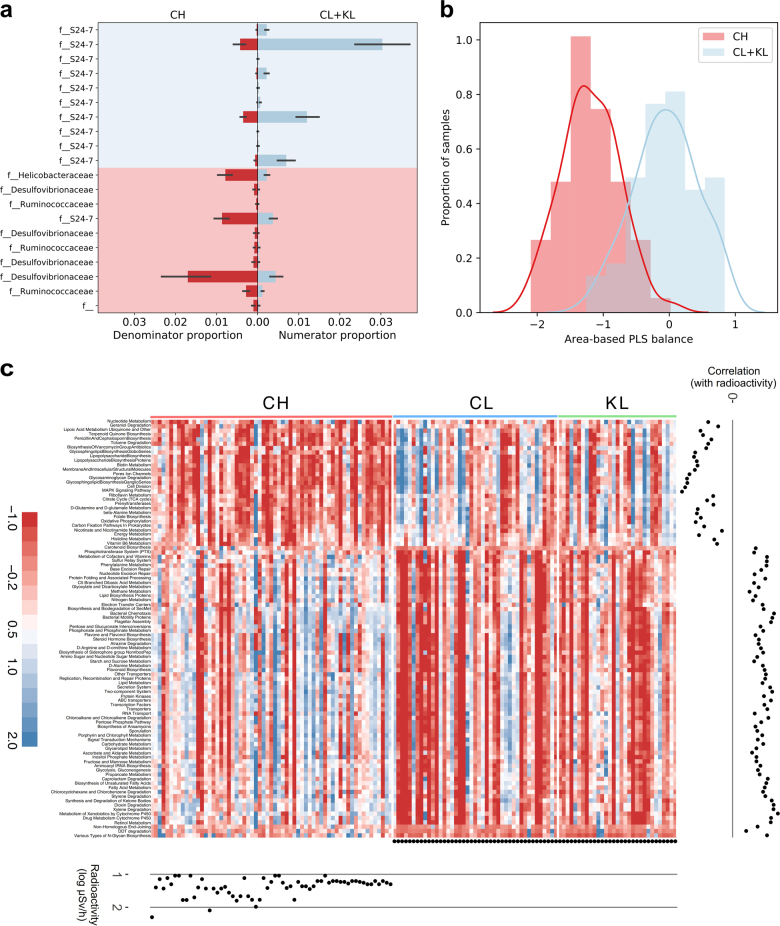
Fig. 2.
Balance Trees analysis and PICRUSt functional predictions for the bank vole gut microbiota. Partial least squares (PLS) balance analysis of a area-differentiated OTUs (shown are the proportions in the two groups of the top 10 OTUs in each group based on PLS score) and b classification of samples to study areas based on OTU composition. c Heat map of the KEGG level-3 functional pathways that significantly differed between contaminated (CH) and both uncontaminated areas (CL and KL). Pathway counts were normalized as implemented in superheat v0.1.0 R package, abundance of each pathway is indicated by a gradient of color from red (low abundance) to blue (high abundance). Full lists of pathways associated with radiation exposure can be found in Supplementary Table 11

