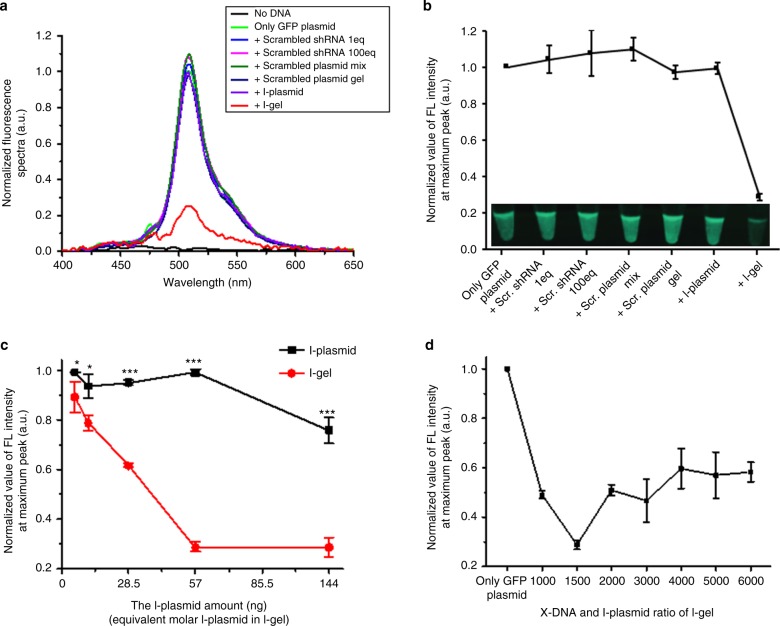
Fig. 2.
Optimization and evaluation of I-gel. a The FL spectra of GFP in each condition (no plasmid, only GFP expression, addition of scrambled shRNA 1 eq, scrambled shRNA 100 eq, scrambled plasmid mixture, scrambled plasmid gel, I-plasmid, and I-gel). b A comparison of the fluorescence intensities at the peak points of the graph (a) and the inset is fluorescence images of each sample. The relative FL intensity (c) with the addition of increasing amount of I-plasmid and I-gel (*P < 0.05, **P < 0.005 and ***P < 0.001, analyzed by t test. Asterisks indicate statistically significant differences between I-plasmid and I-gel), (d) with the variation of X-DNA and I-plasmid ratio in I-gel. For all experiments, 57 ng of I-plasmid has been used except (c). This data was obtained by in vitro transcription/translation with HeLa cell lysate system. Error bars refer to standard deviations from three replicates

