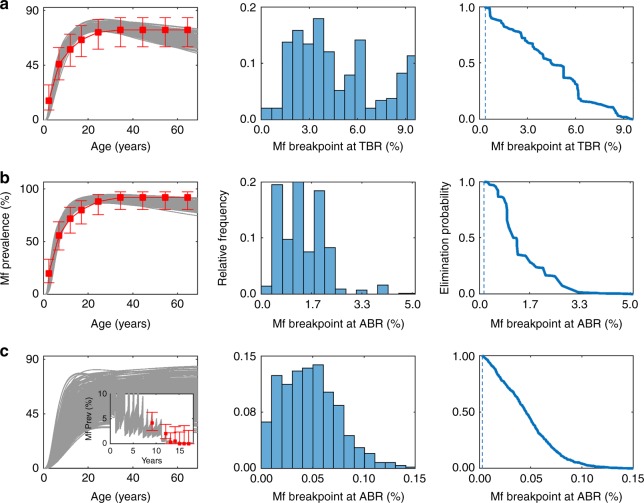
Fig. 1.
Model fits and estimated transmission breakpoints. The model fits (grey curves) to baseline microfilariae prevalence from two onchocerciasis endemic sites, a Buriri, Uganda and b Masaloa, Uganda, and one LF endemic site c Gbuwhen, Nigeria, are shown. For Buriri and Masaloa, age-stratified Mf prevalence patterns (shown in the figure as red squares for estimated plateau-type patterns with error bars representing the 95% binomial confidence intervals) used for fitting were constructed according to the reported community-level Mf prevalence (Tables 1, 2). For Gbuwhen, the model was fit to post-intervention data (shown in the inset plot as red squares with error bars representing the 95% binomial confidence intervals) and the baseline curves were hindcasted. The distribution of the model-calculated Mf breakpoints (centre) and the corresponding inverse ECDFs (right) are shown for sites a–c. The vertical dashed lines in the inverse ECDF plots denote the Mf breakpoint values corresponding to the 95% elimination probability thresholds applicable in each village

