
Fig. 3.
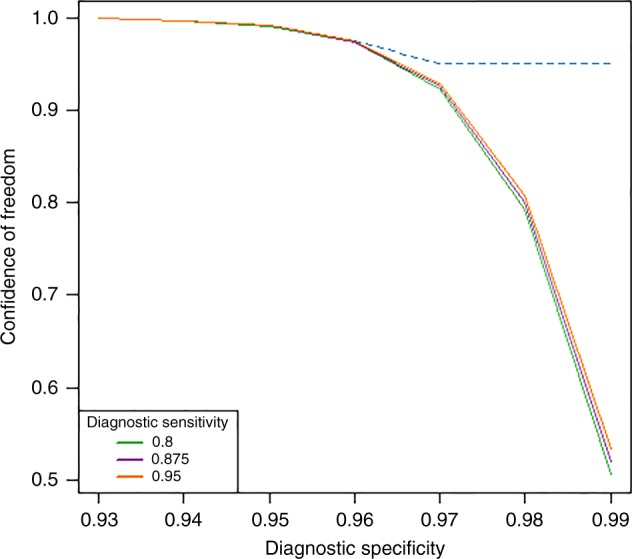
Power of a survey to declare infection freedom in a population. The solid lines depict the change in the power of an infection freedom survey (in the form of confidence for declaring freedom) as the specificity of the diagnostic test used increases to 0.99 for three fixed sensitivity values (Se = 0.8, 0.875, and 0.95) and fixed survey sample sizes. The results show the dramatic decline in the power of a survey to declare infection freedom as diagnostic test specificity increases from 0.95 towards perfect specificity, whereas increases in sensitivity for a given specificity value has only a slight effect. The dotted line shows that the power of the survey can be maintained even at high specificities by changing the sample size. As test specificity increases (for a given sensitivity), confidence of a survey to declare infection freedom can only be maintained at high levels (> 95%) by increasing sample sizes significantly. In the present example, which is based on the 2011 survey results from Bunabutiti (Table 1), the required sample sizes to maintain this high confidence for declaring freedom from onchocerciasis (dotted line) work out to be 123 at Sp = 0.96 to as high as 650 at Sp = 0.99