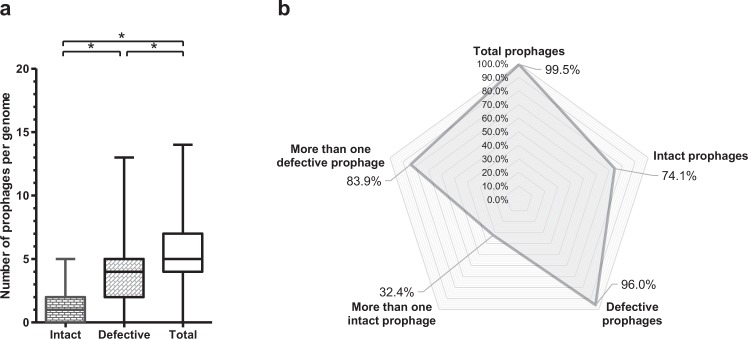
Figure 1.
Prevalence of prophages in Acinetobacter baumannii genomes. (a) Whiskers plot of prophage frequency per bacterial genome. The horizontal line at the center of the whiskers plot represents the median. The bottom and top of the plot represent the first and third quartiles. The external edges of the whiskers represent the minimum and maximum number of prophages per genome. Significant differences (Tukey’s test) of P < 0.05 are represented by*. (b) Prevalence of total prophages, “intact prophages”, defective prophages, more than one “intact prophage”, and more than one defective prophage. Prevalence was determined considering a dataset of 795 A. baumannii genomes.

