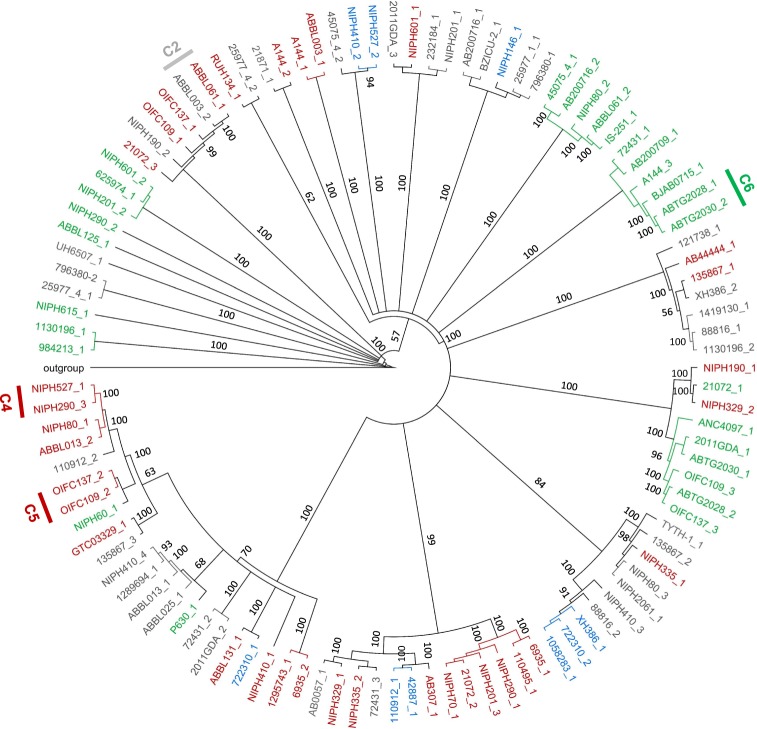
Figure 6.
Phylogenetic tree of prophage proteomic sequences. Tree was constructed using the Jukes-Cantor genetic distance model and the neighbor-joining tree building method in Geneious Tree Builder (Geneious version 9.1.8), with boostrapping set to 100 and tree rooted using Acinetobacter baumannii plasmid pNaval18-231 as the outgroup. Tree branches are proportional to branch length, and branch labels represent bootstrap percentages. Clusters of prophages with proteome identities above 90% are indicated in the tree. Red: Siphoviridae; Green: Myoviridae; Blue: Podoviridae; Grey: family unknown.

