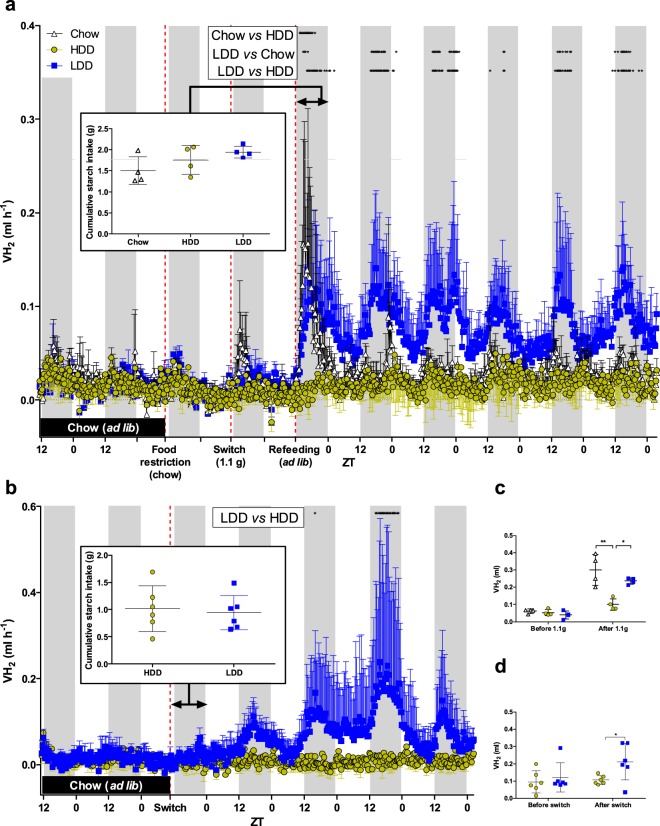
Figure 4.
H2 evolution upon first exposure to starches of different digestibility. (a) Standard chow-fed mice within indirect calorimetry were food-restricted leading to fasting (dotted line), which was followed by feeding 1.1 g of chow (black), HDD (yellow), or LDD (blue; n = 4 per group) prior to the dark phase as a single meal test (2nd dotted line). As a result, they were fasted the next day, and received prior to dark phase ad libitum access to the same diet (3rd dotted line) for an additional 5.5 days. Inset: First 12 h cumulative starch-intake of ad libitum feeding with experimental diets. (b) Chow-fed mice (n = 6 per group) were switched to LDD or HDD without prior food restriction and measurements continued for another 4.5 days. Inset: First 12 h cumulative starch-intake after diet switch. (c) Cumulative H2 production over 12 h before (while food-restricted on chow) and after feeding 1.1 g of chow, HDD, or LDD (n = 4 per group). (d) Cumulative H2 production over 12 h before and after switching directly from chow to HDD or LDD (n = 6 per group). All mice received no other diet than chow during their whole lifetime prior to these experiments and the dietary switch (black bar), but colour usage reflects subgroups after first exposure to new diets. White and grey areas represent light and dark phases, respectively. Time course data was analysed by repeated measures two-way ANOVA with Bonferroni’s test for multiple comparisons (chow vs HDD, LDD vs chow, and LDD vs HDD), and time points where P < 0.05 are indicated with black stars (panels a,b). Cumulative data was statistically compared using unpaired two-tailed Student’s t-test (between HDD and LDD) and one-way ANOVA with Bonferroni’s multiple comparisons post hoc test (between chow, HDD, and LDD); *P ≤ 0.05, **P ≤ 0.01. Data is presented as mean ± s.d. For clarity, either upper or lower error bars are shown. ZT, Zeitgeber time.

