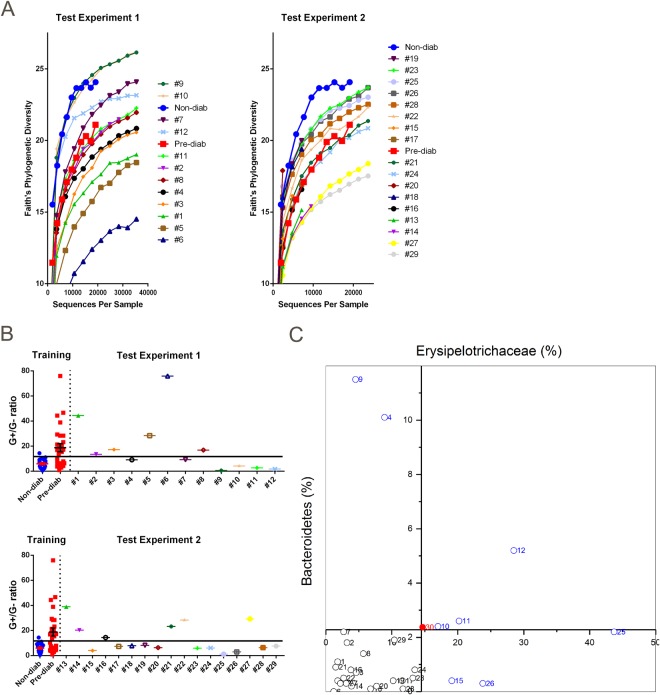
Figure 5.
Prediction of diabetes development in NOD mice at 8 weeks of age. The prediction experiment was repeated using two test groups, comprising 12 and 17 mice, respectively. (A) Use of gut bacterial alpha-diversity for prediction of diabetes development. The individual mouse numbers in the figure are listed in the order of the mouse that had the highest diversity of gut bacteria to the lowest diversity. Non-diab (filled blue circles) and pre-diab (filled red squares) represent the average diversity of the bacteria from non-diab mice and pre-diab mice, respectively, from the training cohorts used as the reference points for comparison with the test experiment. Mice with gut bacterial alpha diversity higher than pre-diab were predicted not to develop diabetes by the end of observation (i.e., mice 9, 10, 7 and 12 in experiment 1 and 19, 23, 25, 26, 28, 22, 15 and 17 in experiment 2). (B) Use of gut bacterial G+/G− ratio for diabetes prediction. The cut-off line was drawn at 15.3 to separate the non-diabetic and pre-diabetic groups according to ROC analysis. Non-diab and pre-diab were the gut bacterial G+/G− ratio of non-diab mice and pre-diab mice, respectively, from the training cohorts. G+/G− ratio of single experimental mice were plotted and the mouse was predicted to be non-diab if the ratio was below the cut-off line or pre-diab if the ratio was above the cut-off line. (C) Use of gut taxonomic profile for prediction. The abundance of Phylum Bacteroidetes and Family Erysipelotrichaceae of the 29 experimental mice were plotted on this 2D scatter diagram. #30 (the red solid circle) represents the average abundance of Bacteroidetes and Erysipelotrichaceae of all non-diabetic NOD mice in the training cohort.

