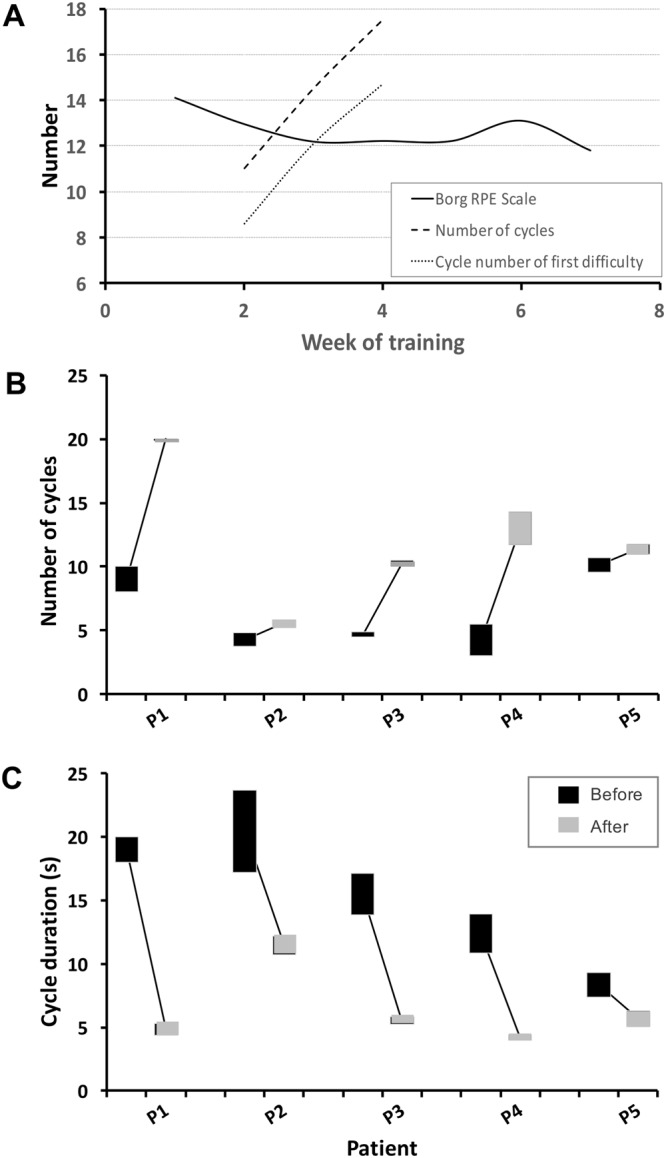
Figure 3.

Results concerning the daily PLM-training. (A) Evolution of perceived difficulty in PML execution during the training period, successively averaged over 1 week of training and over all types of PLM. Signification of curves is given in the inset. RPE scaling was done by P3, and the number of executed cycles as well as the cycle number of first difficulty by P5. (B) Number of cycles that could be executed subsequently before movements blocked due to fatigue, averaged over all types of PLM for each patient (the vertical size of the bars represents the standard error). (C) Cycle duration averaged over all types of PLM for each patient (the vertical size of the bars represents the standard error).
