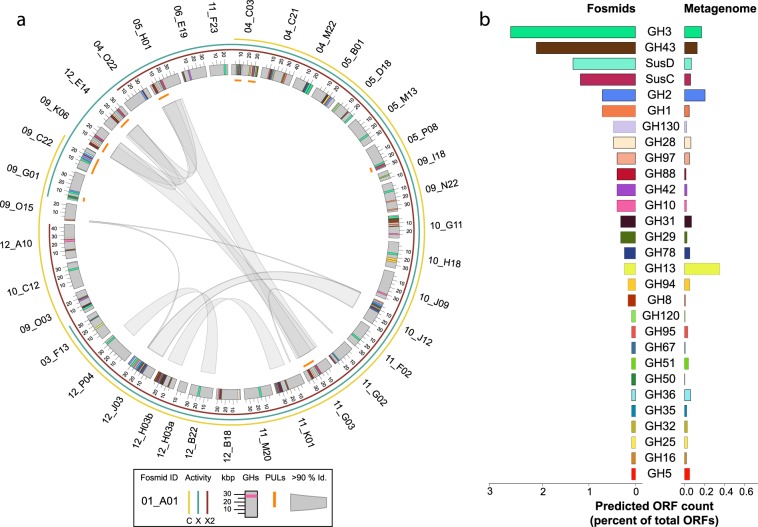
Fig. 2.
Fosmids identified from high throughput screening. a Schematic representing the identified fosmids, gene presence and similarity. Gray bars represent each fosmid and are proportional to their length. Fosmids sharing 100% identity with another fosmid were removed as duplicates. Connections in the center represent areas of 90% or greater nucleotide identity between fosmids as identified by BLASTN. Inner track represents the locations of identified PULs. Outer colored track represents activities identified for each fosmid from functional screening (C: CMU-cellobiose, X: CMU-xylose, X2: CMU-xylobiose). Colored bars within each fosmid represent GH domains as predicted by BLASTP against the CAZy database. b Histogram displays color encoding of GH gene families as well as abundance of each family in the complete fosmid dataset compared to the abundance of the same gene families in the unassembled metagenomic dataset. The abundance relative to the total number of ORFs is shown in parentheses

