Fig. 1.
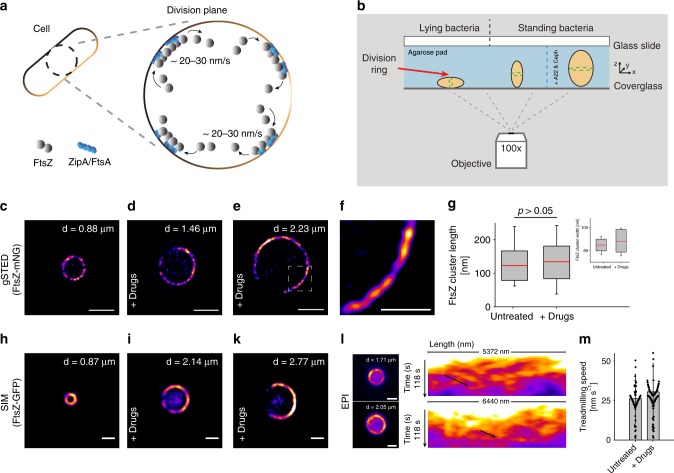
Midcell FtsZ-ring assembly is unaffected by increased cell diameter. a Simplified cartoon showing FtsZ treadmilling at the division plane of an E. coli cell. For clarity, only FtsZ (gray dots), it’s membrane tethers, FtsA and ZipA (blue dots), and the membrane (brown) are shown. b Schematic representation of cell placement for imaging. Green dotted ring in the cells represents the FtsZ-ring (red arrow). Standing cells were trapped in a vertical position in micron-sized holes in agarose pads created using micron-sized pillars. Conditions for proper division ring placement are met when width < length. The left and middle cells represent untreated cells. The cell on the right has increased dimensions due to drug exposure (A22 and cephalexin). c Time-gated STED (gSTED) image of a typical FtsZ-ring (FtsZ-mNeonGreen) in an untreated standing cell. Scale bar = 1 μm. d, e gSTED images of FtsZ-mNeonGreen rings in E. coli cells treated with drugs, showing increased ring diameter. Scale bar = 1 μm. Drugs refer to A22 and cephalexin. f Close-up of representative FtsZ clusters shown in e, from a cell with increased diameter. Scale bar = 0.5 μm. g Quantification of FtsZ cluster lengths in untreated and drug-treated cells. Mean ± S.D. was 122.8 ± 43.9 nm (n = 77) and 132.4 ± 48.7 nm (n = 172) for untreated and drug-treated cells, respectively. No statistically significant difference was measured, p > 0.05. Inset shows cluster widths in untreated (mean ± S.D. = 86.1 ± 6.3 nm (n = 77)) and drug-treated cells (mean ± S.D. = 88.4 ± 9.8 nm (n = 172)). Boxes represent S.D., with red lines indicating mean. Whiskers on the box plots encompass 95.5% of the distribution. h–k Structured illumination microscopy (SIM) images of FtsZ-GFP in E. coli cells (h) untreated or (i–k) treated with drugs. Scale bars = 1 μm. l Snapshots of epifluorescence (EPI) images from time-lapse series of FtsZ-GFP dynamics in drug-treated cells. Scale bars = 1 μm. Corresponding kymographs are shown adjacent to each image. Black arrows point to examples of FtsZ trajectories. m Average treadmilling speed of FtsZ-GFP in untreated (mean ± S.D. = 26 ± 15 nm s−1, n = 102) and drug-treated cells (mean ± S.D. = 30 ± 18 nm s−1, n = 102). Black dots represent individual data points, bars represent mean with error bars representing S.D. “d” in c–e, and h–l indicates cell diameter

