Figure 1.

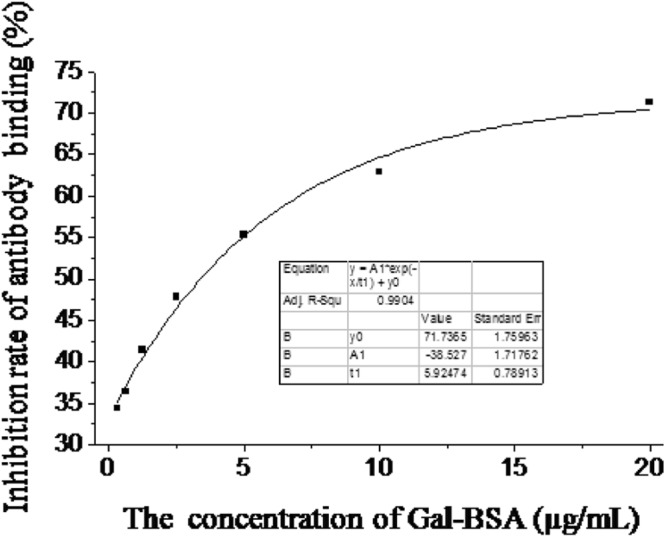
The standard curve of Gal-BSA mixture. The X-axis is concentration of Gal-BSA (µg/mL) and Y-axis is inhibition rate of antibody binding (%). Indication: Origin 8 graphics program was used to create the artwork, and save them as tiff.

The standard curve of Gal-BSA mixture. The X-axis is concentration of Gal-BSA (µg/mL) and Y-axis is inhibition rate of antibody binding (%). Indication: Origin 8 graphics program was used to create the artwork, and save them as tiff.