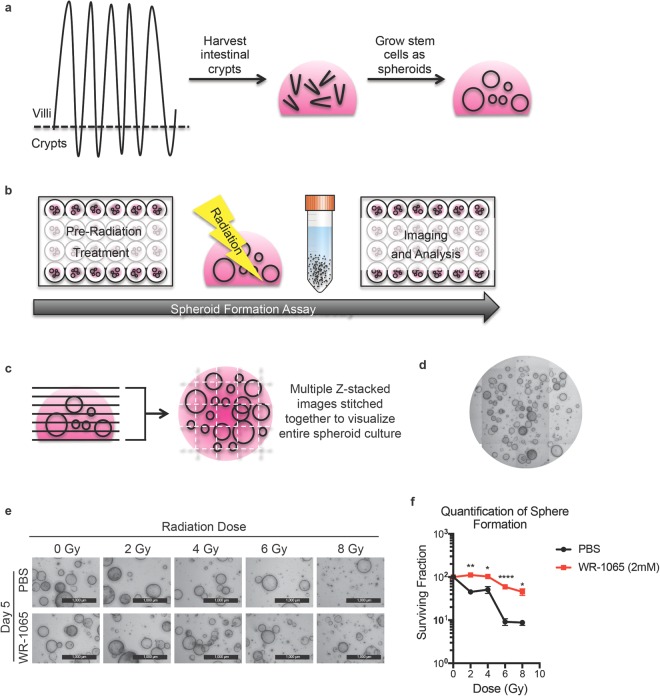
Figure 1.
Spheroid formation assay to identify GI radioprotectors. Schematic representation illustrating how stem cell-enriched epithelial spheroid cultures are established (panel a). Schematic outlining how the spheroid formation assay (SFA) is performed (see text for details, panel b). Z-stack images of treated stem cell-enriched epithelial spheroid cultures are stitched together to visualize spheroids (panel c). A representative image of the stitched z-stack is shown (panel d). Stem cell-enriched epithelial spheroid cultures treated with vehicle (PBS) or 2 mM WR-1065 for 2 h were exposed to the indicated doses of ionizing radiation. Spheroids were immediately dissociated into single cells, replated in Matrigel and imaged 5 days later (panel e) (Scale bars, 1000 μm). Spheroids larger than 150 μm in diameter were quantified and mean surviving fraction is plotted. *P < 0.05, **P < 0.01, ***P < 0.001, ****P < 0.0001 by two-tailed, Student’s t test (N = 3 per group). Error bars are ± SEM.

