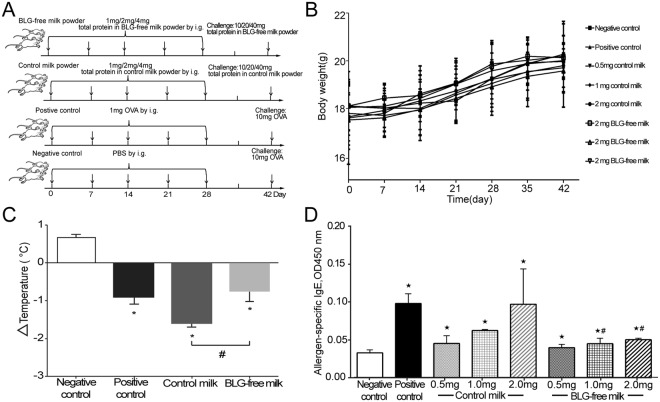
Figure 3.
Analysis of the Balb/c mice Food allergy model. (A) Schematic drawing representing the Balb/c mice food allergy model protocols and doses used in this work. (B) Mean weekly body weight of mice. (C) The variation of rectal temperature (°C). (D) The level of allergen-specific IgE in serum. Results are shown as means ± SD. *P < 0.05, significantly different from the negative control and #P < 0.05, significantly different from the control milk.

