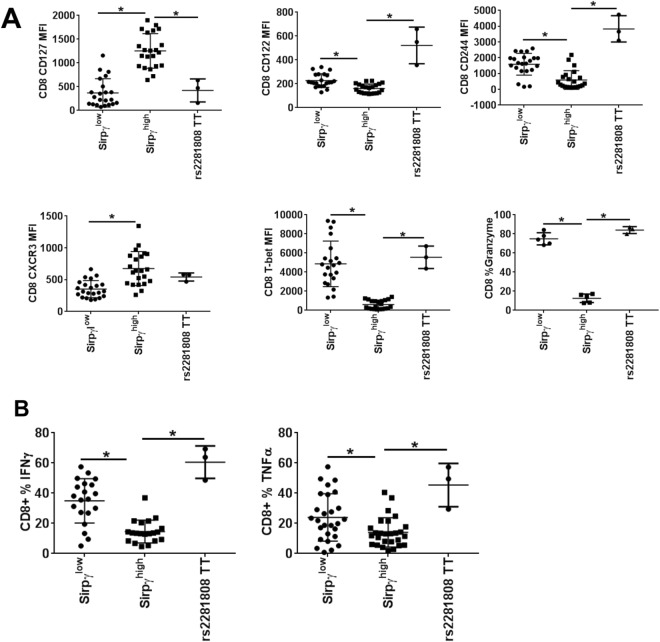
Figure 5.
CD8 T-cells from TT carriers display the same phenotypic and functional profile as SIRPγlow CD8 T-cells from CC and CT carriers. (A) CD8 T-cells from CC, CT and TT carriers were evaluated for their expression of the indicated molecules by flow cytometry. Intracellular staining was performed for T-bet. In the case of CC and CT, cells were gated for SIRPγ-high vs. low cells. (B) PBMC samples from CC, CT, TT carriers were stimulated with PMA/Ionomycin/brefeldin A for five hrs before intracellular staining for IFN-γ and TNF-α. CD8 T-cells from CC and CT carriers were gated on SIRPγlow vs. high cells and evaluated for frequency of cells producing the indicted cytokines. 1-way ANOVA with with Tukey’s posthoc test was performed and p < 0.05 was considered significant.

