Figure 6.
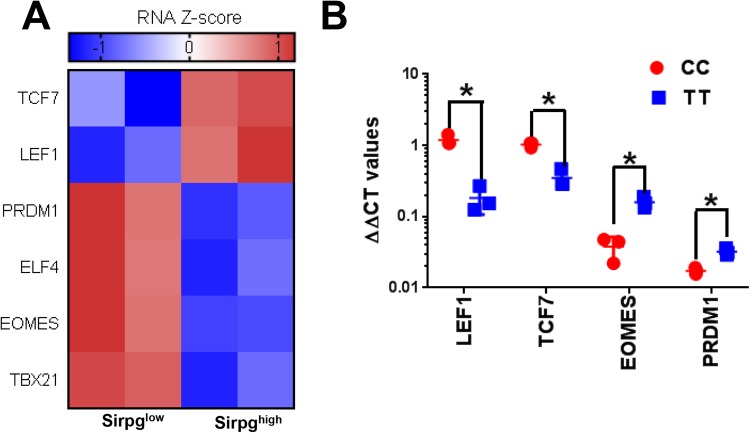
Expression of effector vs. memory-associated transcription factors in SIRPγlow versus SIRPγhigh CD8 T-cells. Transcription factor analysis was performed on RNA sequencing data presented in Fig. 3. For RNA sequencing, SIRPγlow and SIRPγhigh CD8 T-cells were FACS sorted from two CT carriers and subjected to RNA sequencing. Heat maps of SIRPγlow versus SIRPγhigh CD8 T-cells are shown (A). SIRPγlow CD8 T-cells have significant downregulation of transcription factors associated with functional memory formation and are enriched in transcription factors upregulated in effector CD8 T-cells (A). The transcription factor profile was confirmed in CD8 T-cells from three TT carriers vs. CC carriers by quantitative polymerase chain reaction (qPCR) (B). The y-axis shows delta-delta Ct values, after transformation to a logarithmic scale for LEF1, TCF7, EOMES, and PRDM1 in CC vs. TT CD8 T-cells. T-test was performed and p < 0.05 was considered significant.

