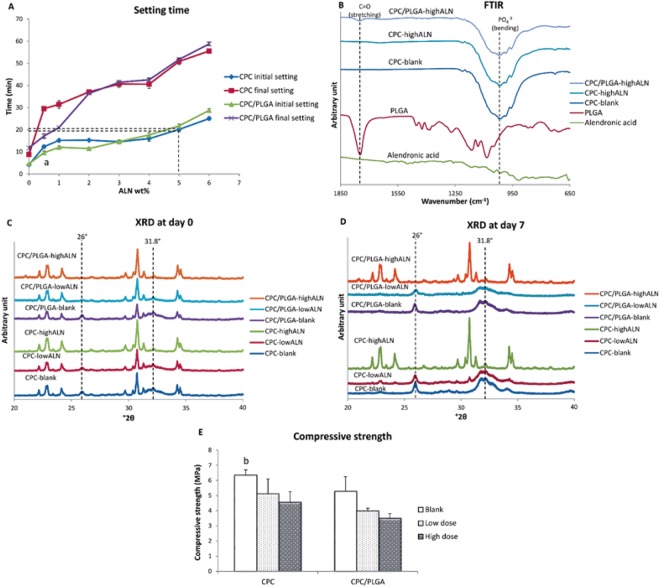
Figure 1.
(A–E) Characterization analysis for CPC/PLGA-ALN composites. (A) initial and final setting time at different ALN wt%, dashed lines indicate the initial setting time at 5 wt% ALN for CPC and CPC/PLGA, ap < 0.05 comparing CPC initial setting time with CPC/PLGA initial setting time; (B) FTIR of Alendronic acid, PLGA, CPC, CPC-highALN and CPC/PLGA-highALN. Dashed lines indicate peaks associated to PLGA (C=O stretching) and CPC (PO4−3 bending) in the materials. (C,D) XRD at days 0 and 7 for the materials, dashed lines indicate HA peaks (26 and 31.8 °2θ); (E) compressive strength, bp < 0.05 for CPC-blank compared to CPC/PLGA-highALN. Error bars represent the SD.

