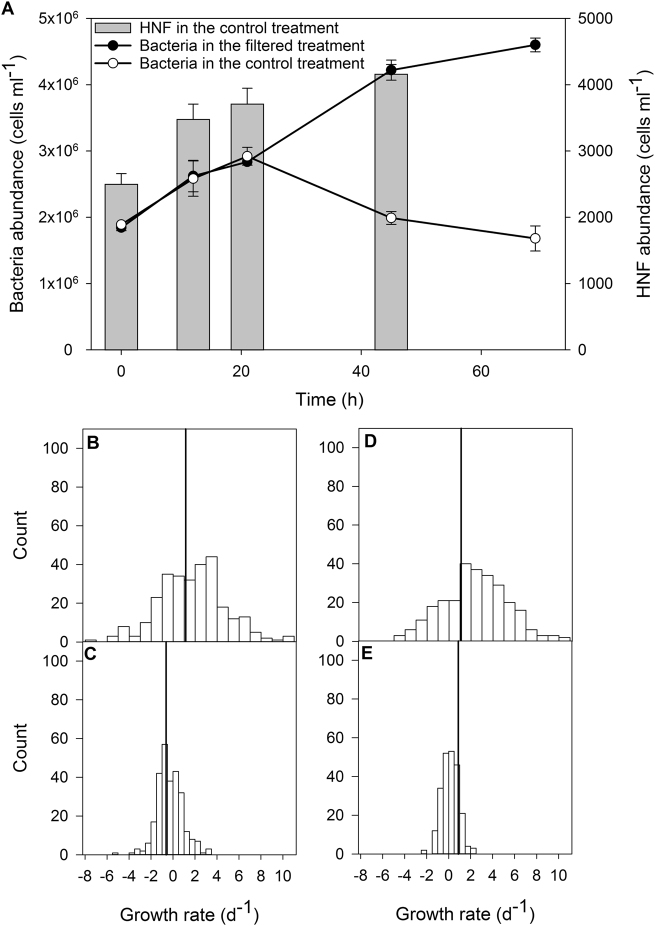
Fig. 6.
a Changes in abundance of bacteria and heterotrophic nanoflagellates (HNF) in the experimental treatments (average from triplicate treatments, error bars show standard deviation); b distribution of the initial specific growth rates (0–21 h) in the control treatment; c distribution of the late specific growth rates (21–69 h) in the control treatment; d distribution of the initial specific growth rates (0–21 h) in the bacterivore-free treatment; e distribution of the late specific growth rates (21–69 h) in the bacterivore-free treatment. The vertical line in b–d corresponds to the average specific growth rates calculated from changes in abundance of bacteria shown in a

