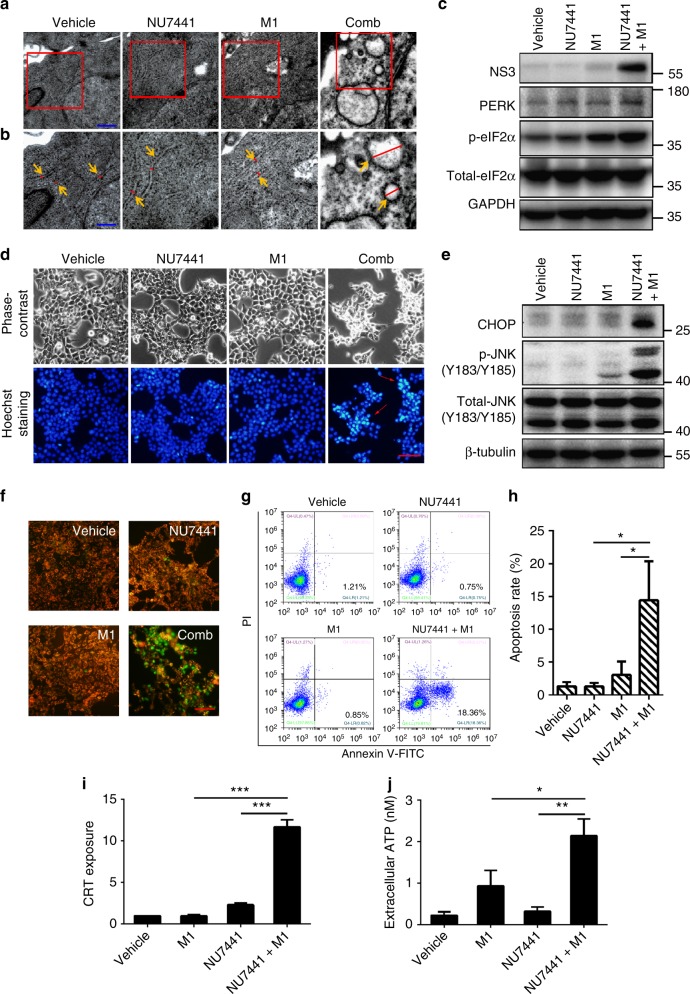
Fig. 5.
DNA-PK inhibitors plus M1 virus induces irresolvable ER stress. a Transmission electron microscopy (TEM) images of tumours after 36 h of treatment with vehicle, NU7441 (1 μM), M1 (MOI = 1) or NU7441/M1. Scale bar: 1 μm. b Higher magnification images from the red box in a. Orange arrows indicate the ER in the tumours. Relative sizes of the ER are indicated by red lines. Scale bar: 0.5 μm. c Cells were treated with vehicle, NU7441 (1 μM), M1 (MOI = 1) or NU7441/M1 for 48 h, and proteins of ER stress markers were analysed by western blot. d Cells were treated with NU7441(1 μM), M1(MOI = 1) or the combination for 48 h. Hoechst 33342 staining was used to stain nuclei of cells. Red arrows indicate the condensed nuclei. Scale bars: 50 μm. e Cells were treated with vehicle, NU7441 (1 μM), M1 (MOI = 1) or NU7441/M1 for 48 h, ER stress-associated apoptotic pathways, including the JNK (Jun N-terminal kinase) pathway and the CHOP (C/EBP-homologous protein) pathway, were analysed by western blot. f JC-1 staining was applied for assessing mitochondrial membrane potential in HCT-116 cells after treatment with drugs for 48 h. Scale bars: 50 μm. g HCT-116 cells were infected with M1 (MOI = 1) with or without NU7441 (1 μM) for 48 h, the cells were stained with fluorescein isothiocyanate-conjugated Annexin V/propidium iodide, and flow cytometric analysis was performed. h Quantification of apoptosis rates from g. n = 3. i, j Cells were treated with vehicle, NU7441 (4 μM), M1 (MOI = 1) or NU7441/M1 for 24 h. CRT exposure was examined by flow cytometry (i) and ATP secretion in supernatant was detected by bioluminescence detection kit for ATP (j). n = 3. Data represent the mean ± SD in h–j. *P < 0.05; **P < 0.01; ***P < 0.001 by one-way ANOVA

