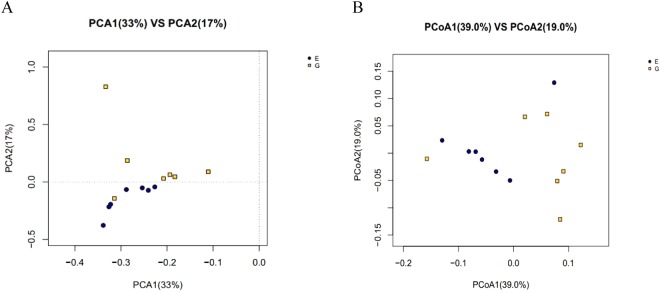
Figure 3.
Beta-diversity analysis of microbial communities by using principal component analysis (PCA) based on Operational Taxonomic Units (OTUs) and principal co-ordinates analysis (PCoA) based on weighted UniFrac distances (n = 7). Abscissa represents the first principal component, ordinate represents the second principal component, and the percentage represents the contribution of the principal component to the sample difference. E, control group; G, treatment group.

