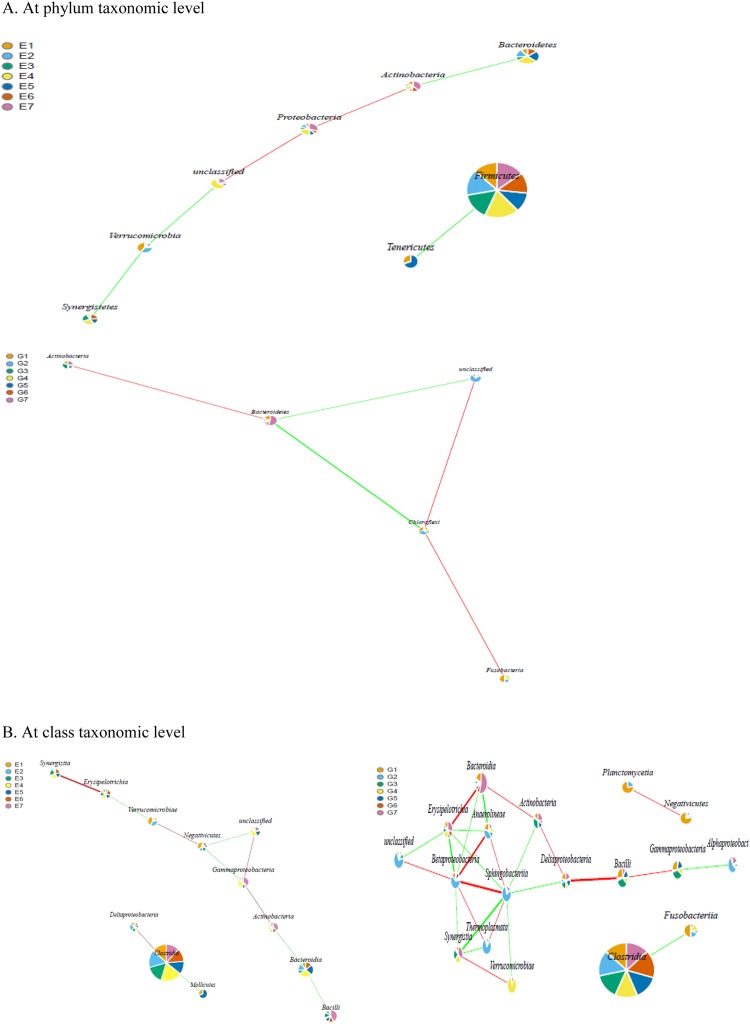
Figure 6.
The co-network pattern of cecal microbiota at phylum (A) and class (B) levels in broiler chickens (n = 7). The significance of correlation was set as P <0.05 and expressed by the dotted line, while the high significance of correlation was set as P <0.01 and expressed by the full line. The red and green lines among nodes stand for the positive and negative correlations, respectively. The weight of the lines correspond to the correlation coefficients, whose values were higher and lower than 0.8 were represented by the thick and thin lines, respectively. The diameter of the nodes was proportional to the relative abundance. Taxa in brackets are based on annotations suggested by the Greengenes database. E, control group; G, treatment group.

