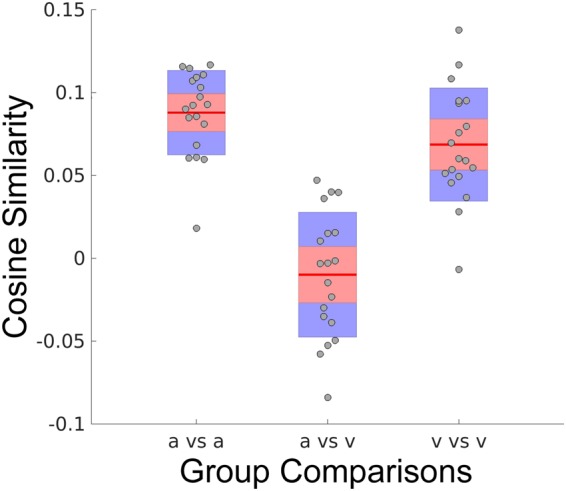
Figure 5.

Quantitative group-level comparison of the cosine similarities within and between the neural activation encodings of arousal (a) and valence (v). Similarities are presented as boxplots; gray circle markers depict group-level mean similarity scores for each participant; horizontal red segments indicate the mean distribution values; upper and lower red filled areas represent the 95% confidence intervals of the means; and, blue filled areas represent the distributions’ first standard deviations. Neural encoding similarity is measured according to the cosine of the angle between the vectors describing the compared encoding models of the SVM hyperplanes (see Materials and Methods: Calculation of Cosine Similarity). For each participant, the group-level similarity is formed from the group average between the participant’s hyperplane and the comparison hyperplanes (excluding self-similarity).
