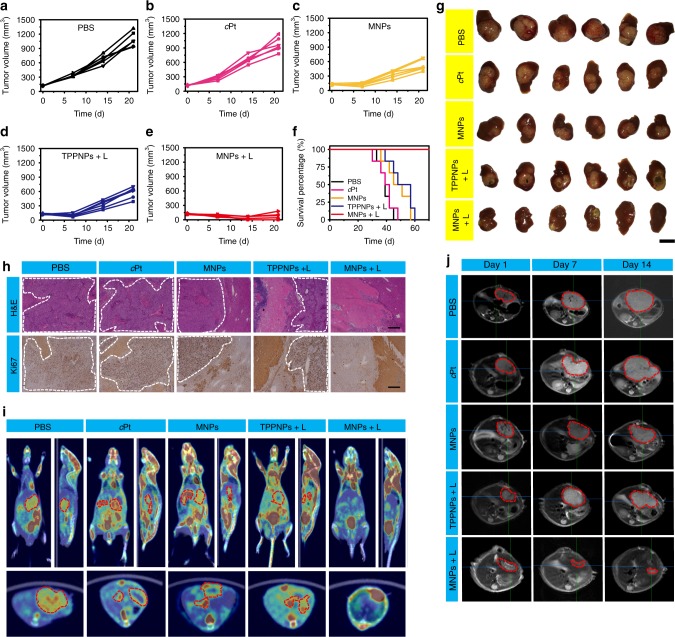
Fig. 9.
Treatment of orthotopic liver cancer. Tumor volume changes of the mice bearing orthotopic LM3 tumors treated with a PBS, b cPt, c MNPs, d TPPNPs + L, or e MNPs + L after one injection (n = 6). f Kaplan–Meier survival curves of the mice bearing orthotopic LM3 tumors treated with different formulations. g Photo images of the liver tissues containing LM3 tumors collected from the mice treated with different formulations. h H&E and Ki67 staining of the liver tissues from each group. The white dashed circles denote the tumor tissues. Scale bar is 500 μM. i PET/CT images of the mice treated with different formulations. The red dash circles denote the orthotopic hepatocellular carcinoma tumors. (j) MRI images of the mice treated with different formulations. The red dashed circles denote the orthotopic hepatocellular carcinoma tumors. The laser density was 0.3 W cm–2 at 671 nm, and the irradiation time was 10 min. The data are expressed as means ± s.d

