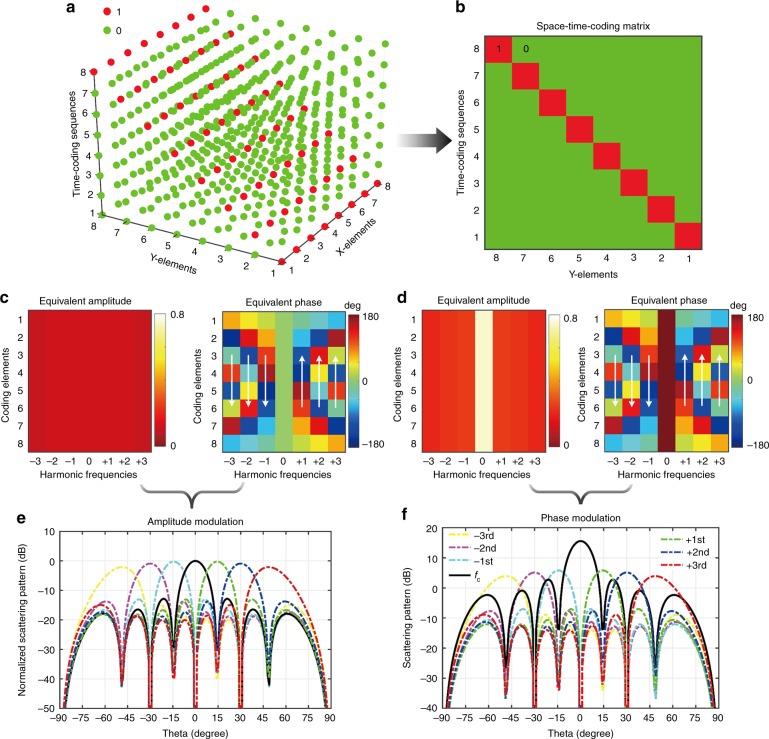
Fig. 2.
Harmonic beam steering. a, b 3D space-time-coding matrix and corresponding 2D coding matrix, respectively. The red and green dots represent “1” and “0” digits, respectively. c, d Equivalent amplitude and phase distributions pertaining to AM and PM schemes, respectively. The white arrows indicate the phase gradients that emerge at the various harmonic frequencies. e, f Corresponding 1D scattering pattern cuts (at φ = 90°) at different harmonic frequencies pertaining to AM and PM schemes, respectively

