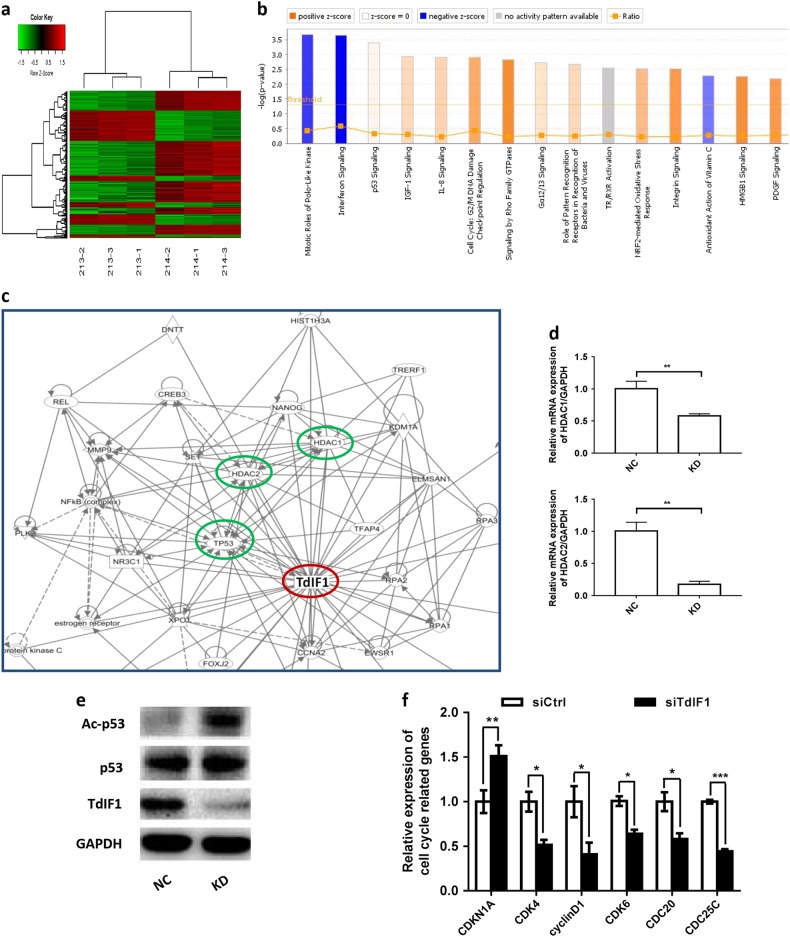
Fig. 4.
TdIF1 gene interaction pathway. a Hierarchical clustering of differential gene expression in A549 cells transfected with shTdIF1 (KD samples 213–2, 213–3 and 213–1) vs. control shCtrl (NC: 214–2, 214–1, and 214–3) vector. In the heat map, columns represent samples, and rows represent genes. The upper dendritic structure is the aggregation or classification of all samples according to the expression profile of different genes, while the left dendritic structure indicates the expression pattern aggregation of different genes. Red represents relatively high gene expression, green represents relatively low gene expression, black indicates no significant change in gene expression, and gray indicates undetected genes. Fold change >1.5 and FDR<0.05 were used as standards for screening. b The top 15 significant pathways of differential gene expression in A549 cells transfected with shTdIF1 vs. control shCtrl vector using Pathway Enrichment Analysis. The X-axis is the name of the pathway, and the Y-axis is the significance level of enrichment (negative logarithmic transformation at the base of 10). Among these, orange represents activated pathways (Z-score > 0), blue represents suppressed pathways (Z-score < 0), and the gradation of orange and blue represents the degree of activation or suppression (in accordance with the internal algorithm and IPA standard that a Z-score > 2 for a pathway represents significantly activated, while a Z-score < -2 for a pathway represents significantly suppressed); the ratio represents the number of differentially expressed genes in this signaling pathway to the number of all genes contained in this pathway. c In silico analysis of the TdIF1 gene interaction network. The protein interaction network map was built using the Ingenuity Pathway Analysis software (Qiagen) to determine the putative interactions of interest (blue circles) with TdIF1 (red circle). d Gene expression after gene silencing of TdIF1. The lung cancer cell line A549 was cultured and transfected with TdIF1 shRNA lentiviral vector (KD) or control nonspecific siRNA vector (NC) at an MOI of 10 for 24 h. Total RNA was collected from the cells after gene silencing, and the expression of HDAC1 and HDAC2 was detected by qPCR. e p53 and acetyl-p53 expression levels in TdIF1 knockdown A549 cells. A549 cells were transfected with siTdIF1 (KD) or control nonspecific siRNA vector (NC) for 72 h, followed by immunoblotting analysis using the indicated antibodies. f Expression of cell cycle-related genes after gene silencing of TdIF1. The A549 cells were transfected with siTdIF1 or control nonspecific siRNA vector (NC) for 48 h. The expression of CDK4, cyclin D1, CDK6, CDC20 and CDC25C was detected by quantitative RT–PCR. Error bars represent the standard deviation of three experiments (*P < 0.05)

